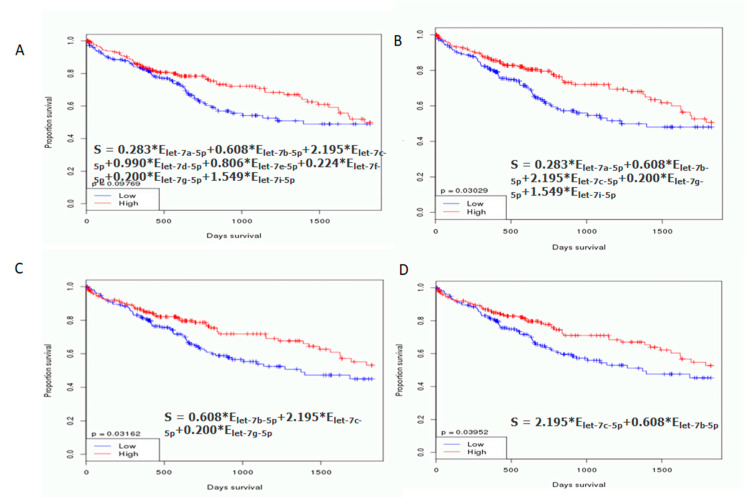
Figure 4.
Kaplan–Meier (KM) survival analysis curve for let-7 family expression in TCGA-LIHC patients. The KM survival curves were examined according to (A) let-7 a/b/c/d/e/f/g/i expression level and (B) let-7 a/b/c/g/i expression levels. No differences in overall survival were observed. (C) let-7 b/c/g expression levels and (D) let-7 b/c expression levels show clear differences in overall survival. Statistical significance was obtained by log-rank tests, with α = 0.05.

