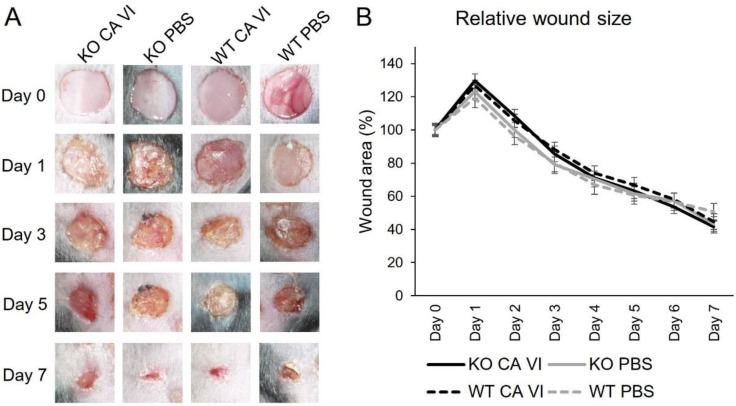
Figure 2.
The purified CA VI and macroscopic analysis of the wounds. (A) Examples of skin wounds at different timepoints. (B) The wound sizes relative to the size on the wounding day (day 0) were calculated from the measurements of digital photographs. Error bars represent SEM, n = 8. No statistically significant difference was observed by analysis of variance.

