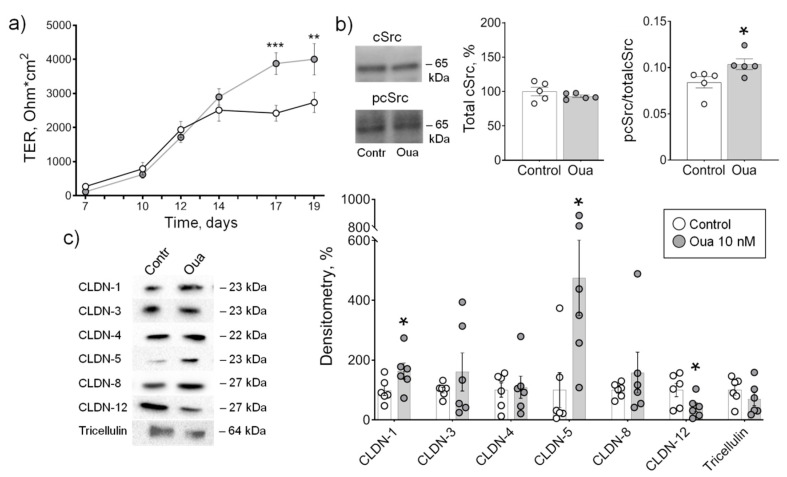
Figure 1.
Epithelial barrier formation in IPEC-J2 cells grown in control medium and in the presence of 10 nM ouabain (Oua). After 7 days of culture, transepithelial resistance (TER) values were determined every 2–3 days using an EVOM volt-ohmmeter; after 19 days, cells were used for subsequent analysis. (a) Transepithelial resistance (TER) (n = 6 for each group). (b) The expression level of total cSrc (central plot, the relative expression of cSrc protein shown as a percentage of average level in control samples taken for 100%) and the cSrc-kinase activation by phosphorylation (right plot, shown as a ratio between immunoblot intensity corresponding to phosphorylated pcSrc over total cSrc, as it is shown in the representative immunoblots in left panel) (n = 5 for each group). (c) Western blot analysis of claudin (CLDN) and tricellulin expression (n = 6 for each group); left panel shows representative immunoblots. Original images for Western blots using Stain-Free gels as a loading control are shown in Supplemental Materials. The number of symbols corresponds to the number of samples. One-way ANOVA with Dunnett correction: * p < 0.05, ** p < 0.01 and *** p < 0.001 compared with the corresponding control.

