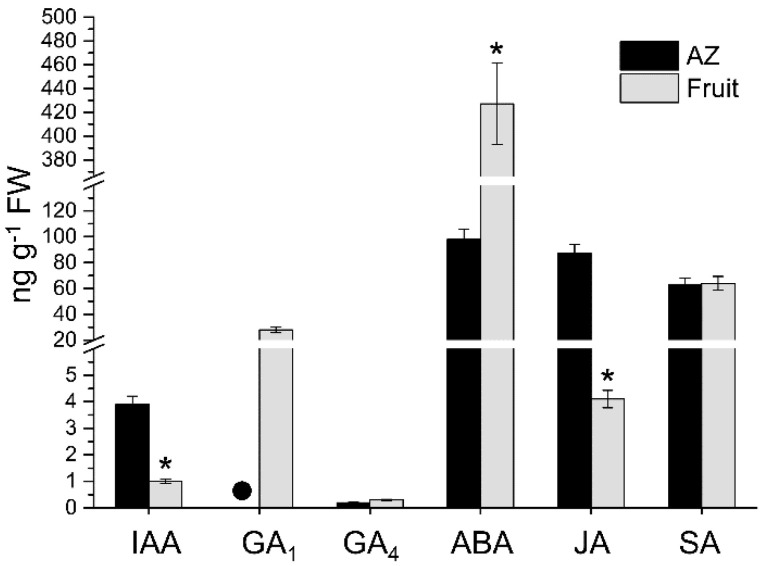
Figure 2.
Profiles of IAA, GA1, GA4, ABA, JA, and SA levels measured from olive AZ and fruit (pericarp) at the last stage of ripening (217 DPA). Hormone levels not detected are indicated by a black dot (●). Data are the means ± SD of three biological replicates with three technical repeats each. Statistically significant differences based on unpaired Student’s t-test at p < 0.05 are denoted by an asterisk.

