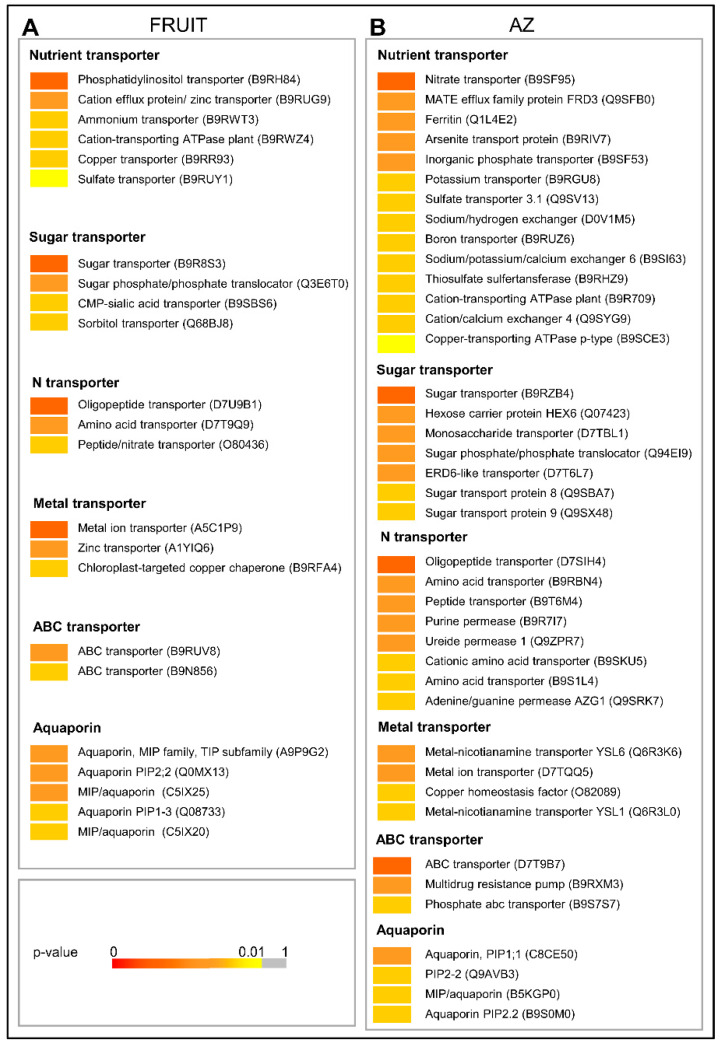
Figure 7.
Expression profiling of (A) fruit-enriched or (B) AZ-enriched genes related to transport as reconstructed from the pyrosequencing transcriptomes. Sequence transcripts showing significant variations (p < 0.01). p-values are visualized in a color-code scale. Additional information on the transport-related genes is presented in Table S4.

