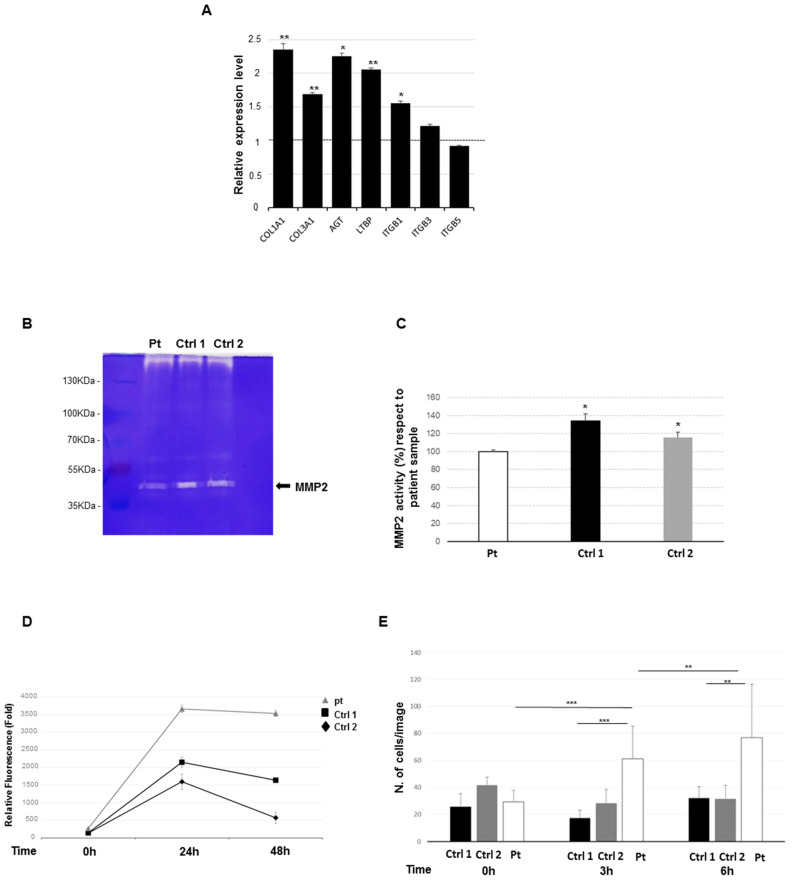
Figure 4.
Analysis of fibrotic profile and proliferation study. (A) Trans-activation of pro-fibrotic genes was assessed by qPCR monitoring endogenous levels of COL1A1, COL3A1, AGT, LTBP1, IGTB1, IGTB3, and IGTB5. The fold change value is relative to the mean expression levels of two controls, which were set as value 1 and showed by a dashed line on the histogram. Scale bars represent standard errors. Values are expressed as mean ± SEM (* p < 0.05, ** p < 0.03, n = 3). (B) Representative gelatin zymography for matrix metalloproteinase-2 (MMP2), from patient (Pt) and two control (Ctrl) lines. The molecular weight is indicated. (C) Quantification of MMP2 activity based on zymography assay. Experiments were performed in triplicate, * = p < 0.05. (D) Graphic result of viability assay (PrestoBlu) in patient and controls cells. The rate of proliferation viability was annotated for 48 h. Results were statistically analyzed by ANOVA test. (E) Quantitative analysis of cell migration is given as the mean ± SD of cells per field. Results were normalized against the control gel condition. ** p < 0.03, *** p < 0.01.

