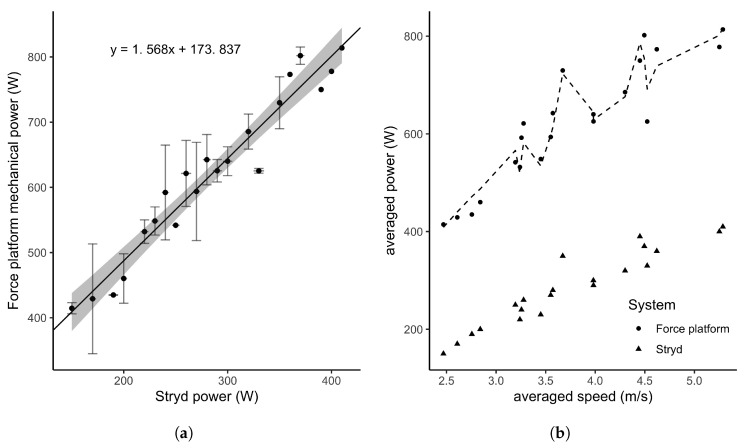
Figure 4.
Comparison of PO estimated by the Stryd power meter and the force platform. The left plot (a) represents the strong positive relationship between the Stryd and the reference measures. The right plot (b) represents the averaged PO in response to speed, where the dotted line is the corrected Stryd PO (see text for details).

