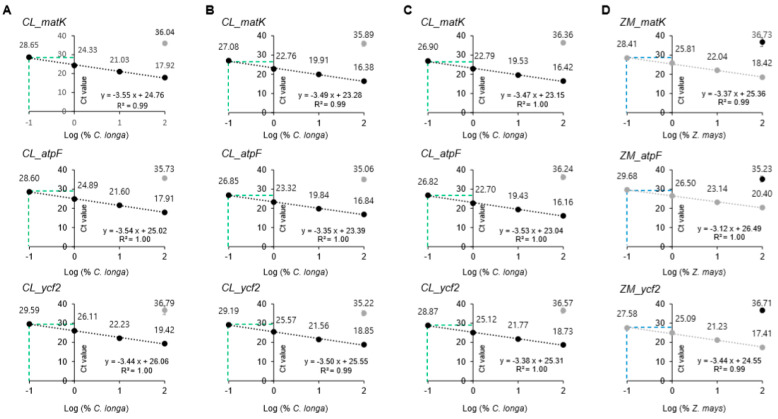
Figure 3.
Standard curve of cycle threshold (Ct) values obtained on the basis of efficiency and correlation of coefficient (R2) by reference binary mixtures. The x-axis represents log percentage of the target species (%) and the y-axis represents means of Ct value ± SD. plotted against the logarithm of the target species concentration (100, 10, 1, and 0.1%). (A–C); each C. longa rhizome powders were mixed with three different plant powders (Z. mays, O. sativa, and T. aestivum) by ten-fold dilutions (0.1, 1, 10 and 100%, final mass of 2g) and the each mixture gDNA(10 ng/uL) was amplified using the C. longa targeting primer sets (CL_matK, CL_atpF, and CL_ycf2). The green dotted line means the 0.1% binary mixture Cts amplified using the C. longa targeting primer sets, CL_matK, CL_atpF and CL_ycf2) (A) binary mixture of C. longa and Z. mays; (B) binary mixture of C. longa and O. sativa; (C) binary mixture of C. longa and T. aestivum. (D) Z. mays powders were mixed with C. longa rhizome powders by ten-fold dilutions (0.1, 1, 10 and 100%, final mass of 2g) and each mixture gDNA(10 ng/uL) was amplified using the Z. mays targeting primer sets (ZM_matK, ZM_atpF, and ZM_ycf2). The blue dotted line means the 0.1% binary mixture Cts amplified using the Z. mays targeting primer sets, ZM_matK, ZM_atpF and ZM_ycf2). The real-time PCRs were carried out in triplicate (n = 3).

