
Figure 4.
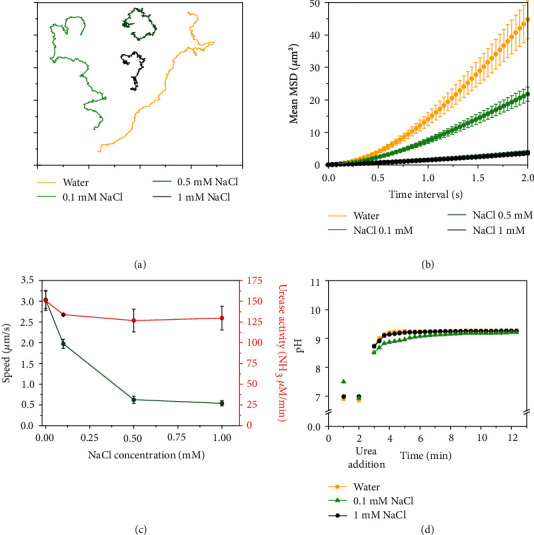
Motion dynamics, enzymatic activity, and pH change produced by urease micromotors for different concentrations of NaCl at 200 mM urea. (a) Representative trajectories (axis divided in 5 μm). (b) Average micromotor MSDs. (c) Average speed and enzymatic activity of micromotors. In (b, c), results are shown as the mean ± standard error of the mean. (d) pH change produced by micromotors.