
Fig. 1.
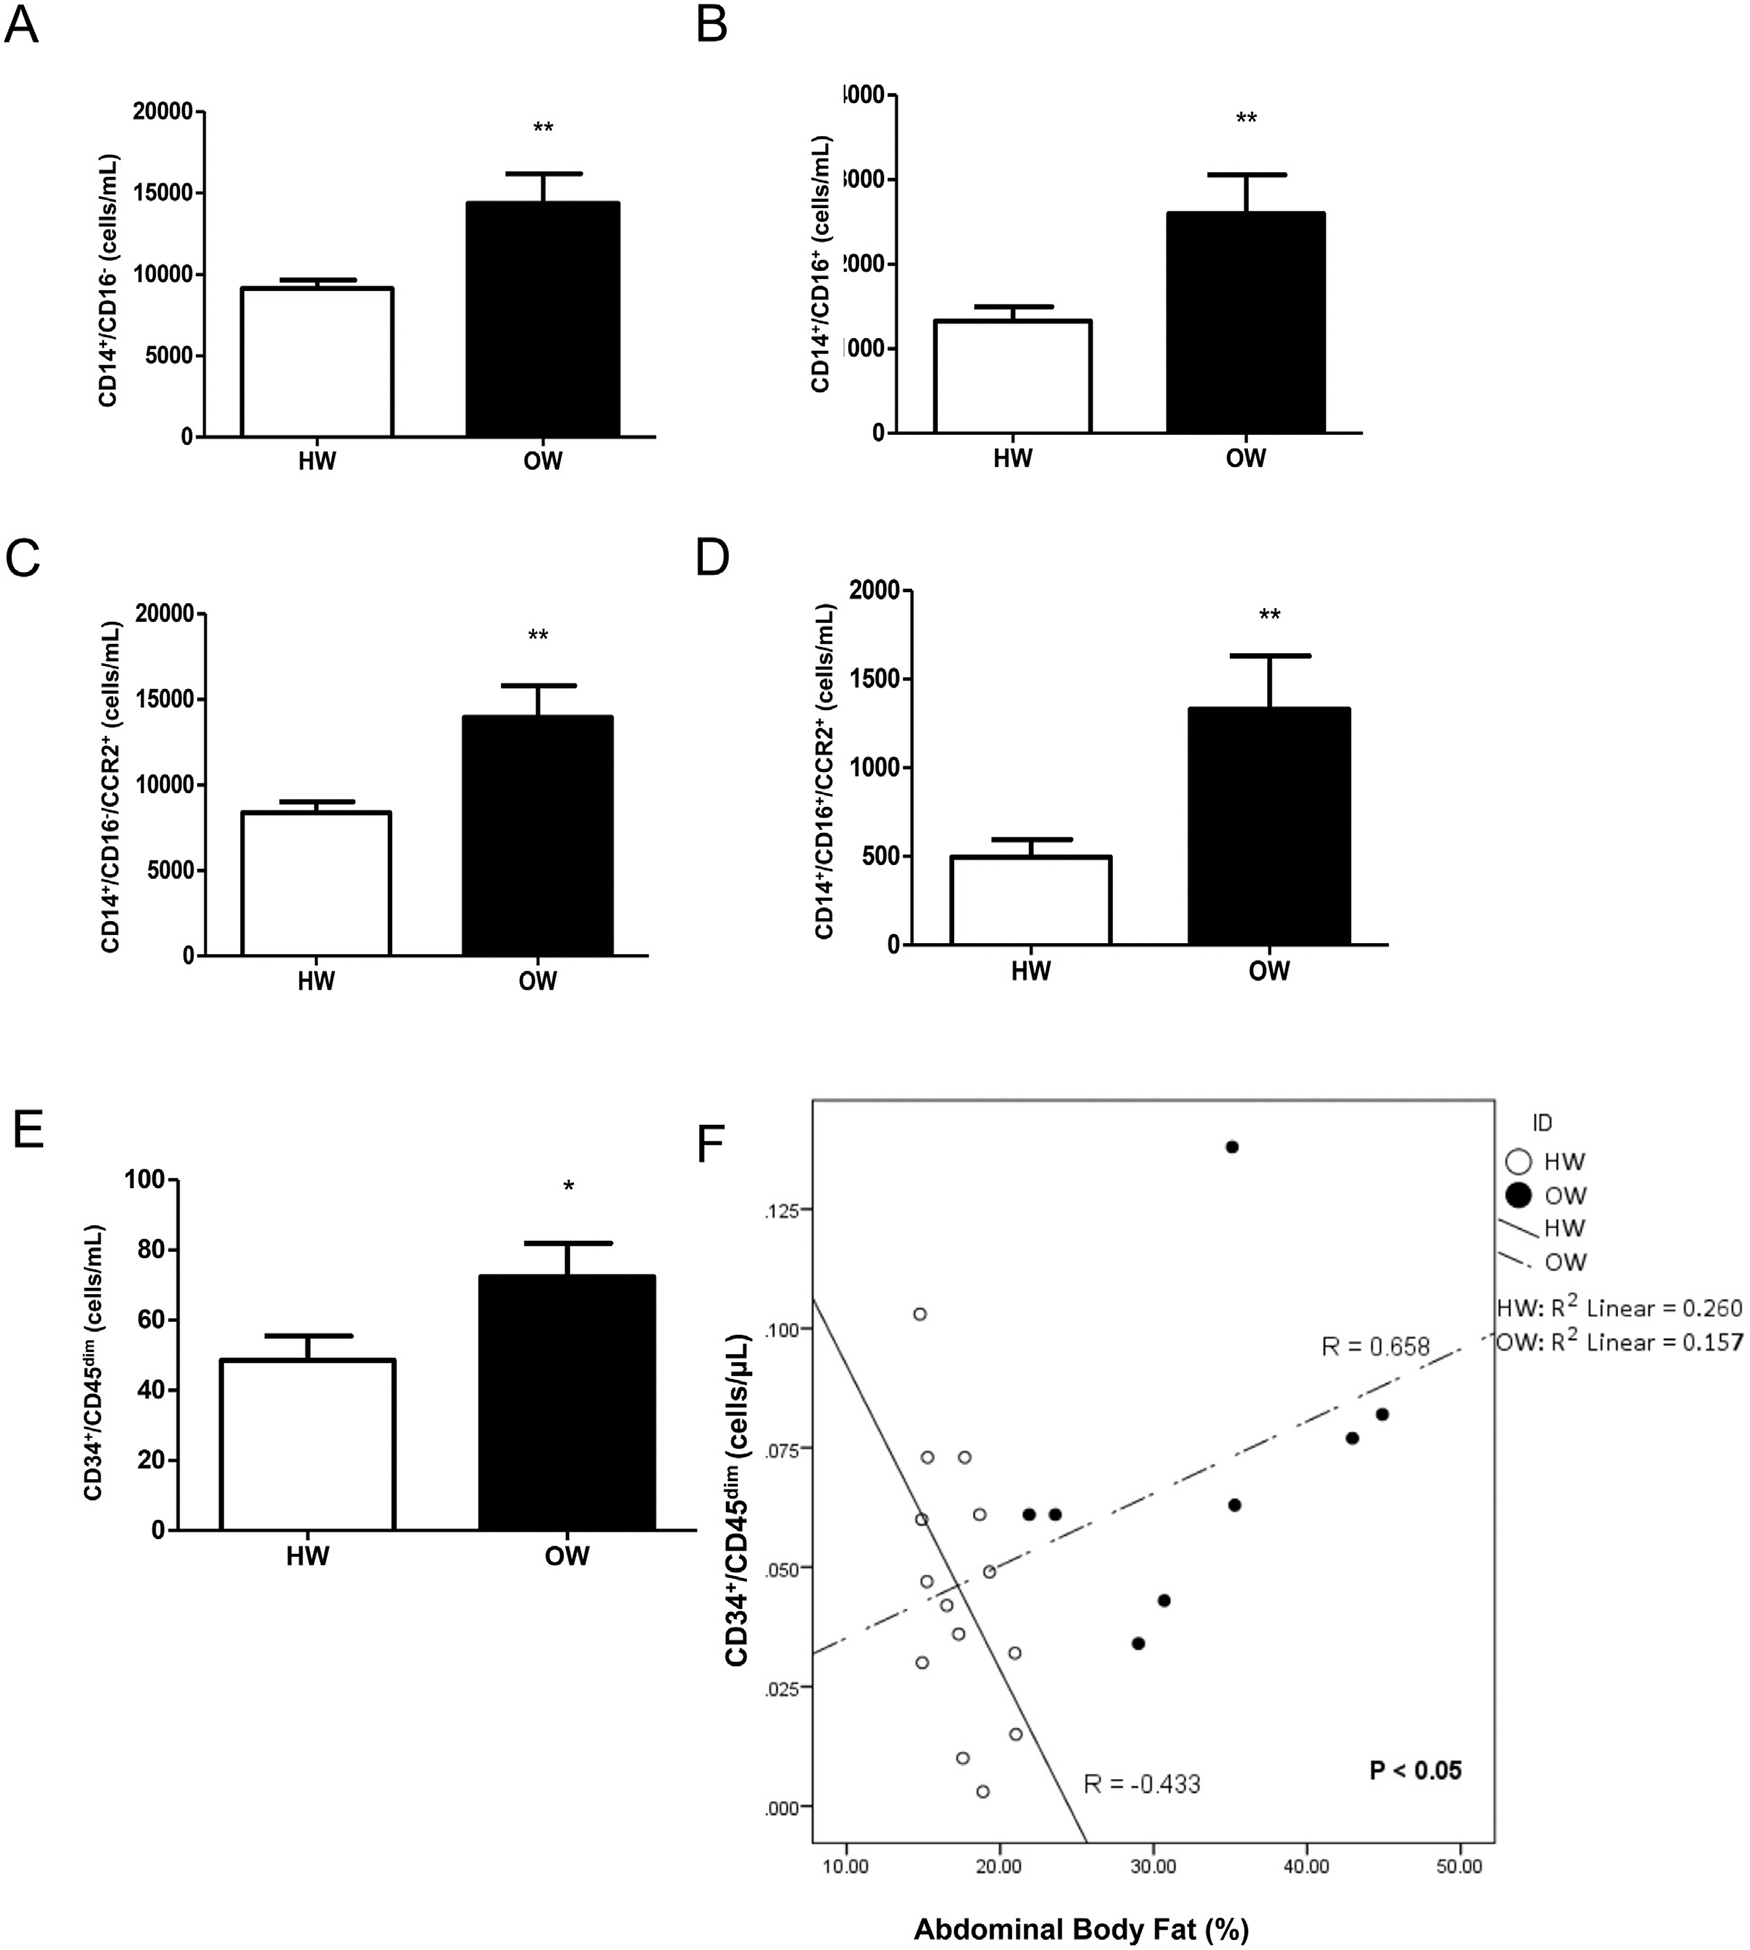
Inflammatory monocyte content and phenotype in HW and OW. Concentrations of classical (A) and non-classical monocytes (B) with and without expression of CCR2 (D and D), and CPCs (E) in the healthy weight (HW) and overweight/obese children (OW); n = 16 HW and n = 11 OW for figures (A–E). Spearman’s Rho correlations (F) between CPCs and abdominal body fat percentage in HW and OW; n = 14 HW and n = 8 OW. Data are presented as mean ± SEM, from, with ** indicating p < 0.01