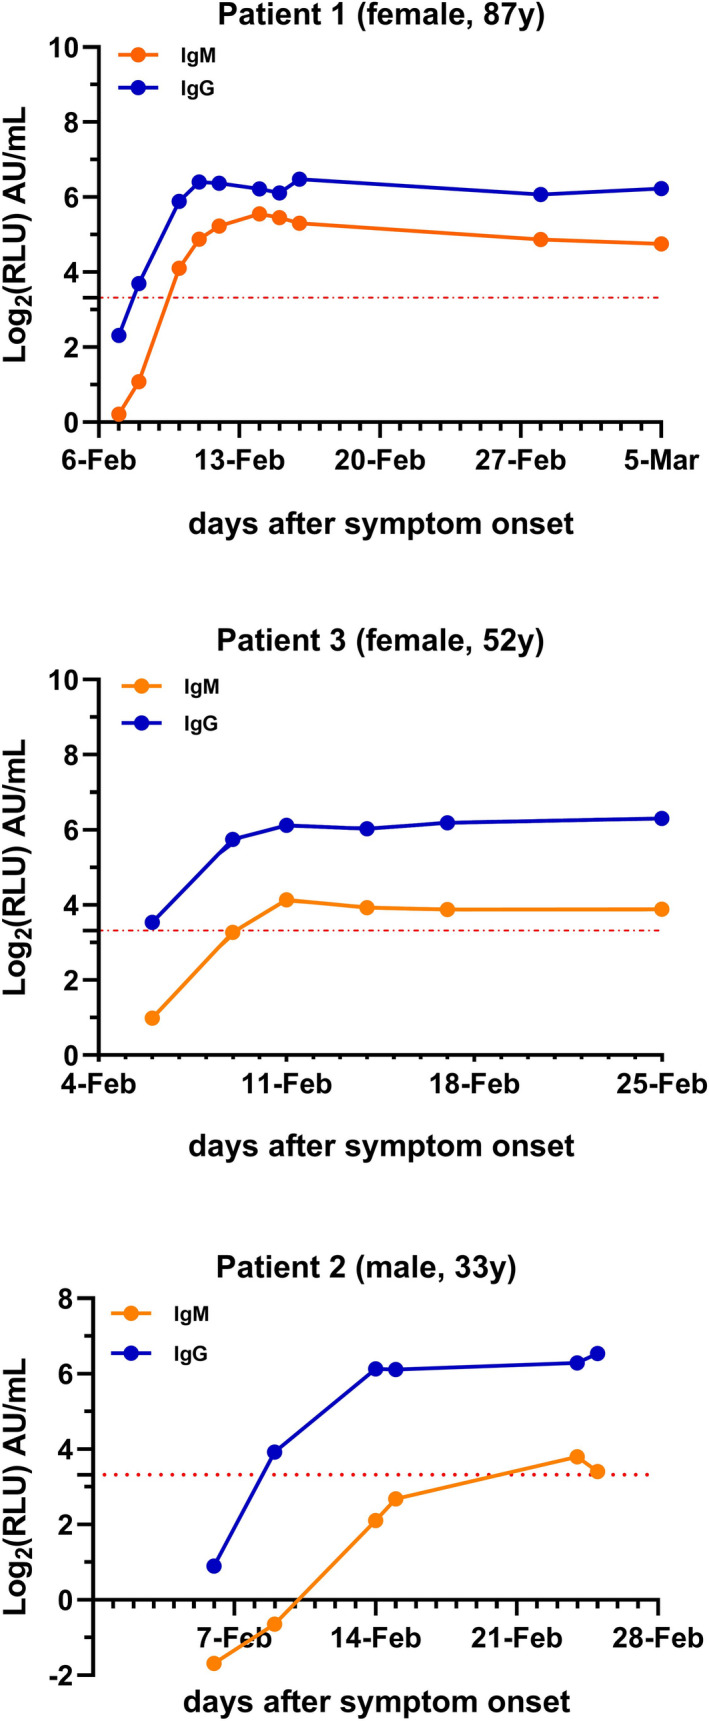
Figure 1.

A relatively complete time course of the IgM and IgG response was observed in 3 patients. IgG is depicted in blue, and IgM is depicted in orange. The x‐axis shows the synchronous date of detection of IgM and IgG from the day of symptom onset. The y‐axis shows the log2 of IgM and IgG concentrations (Log2RLU). The red dotted line is the cutoff value y = Log210
