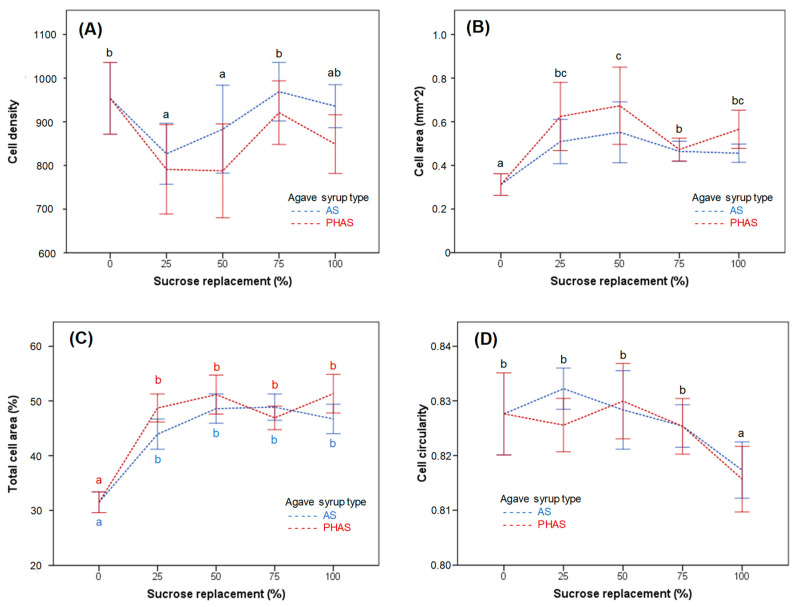
Figure 4.
The impact of sucrose replacement by AS and PHAS on the muffin crumb structure, namely cell density (A), cell area (B), total cell area (C), and circularity (D). Error bars represent 95% confidence intervals. The different subscript letters of the same color represent Tukey’s homogeneous groups, with significant (p < 0.05) differences between different sucrose replacement levels for AS (blue letters), PHAS (red letters), or for both types of agave syrup when there was no interaction between the sucrose replacement and agave syrup type (black letters).

