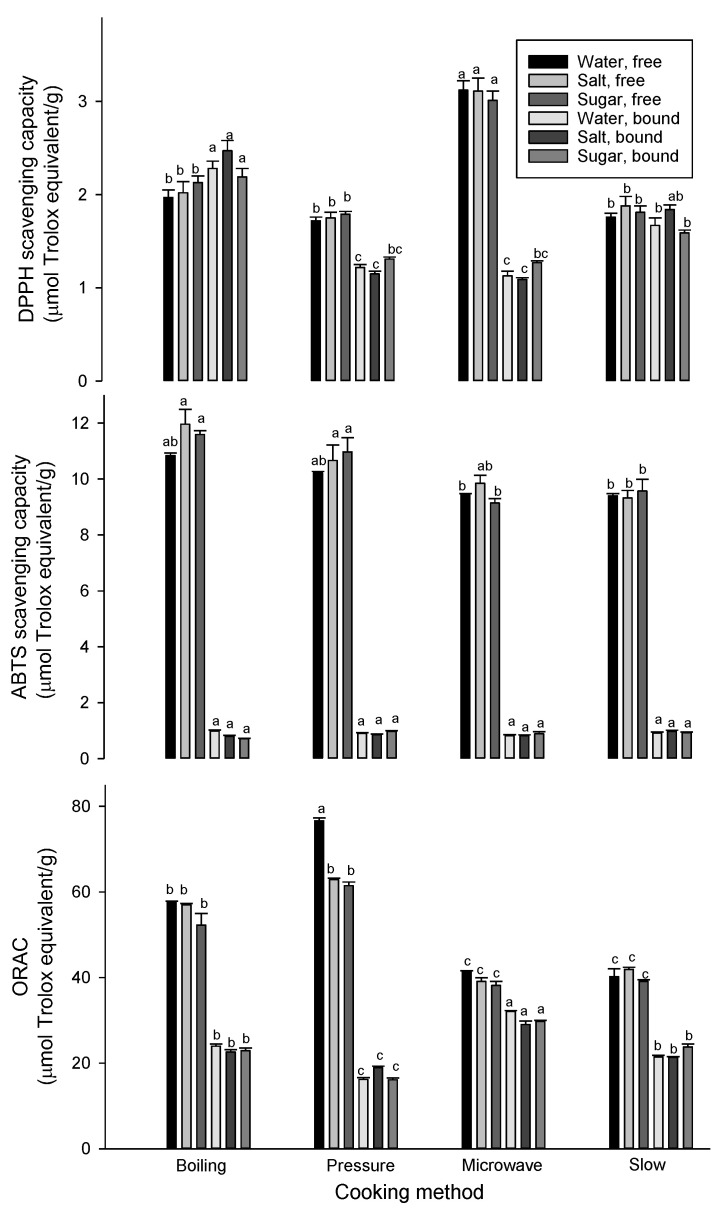
Figure 3.
Antioxidant capacities of free and bound phenolic extracts of peas (µmol trolox equivalent/g, db) measured by DPPH (top), ABTS (middle) and ORAC (bottom) assays. For free or bound phenolic extract, means followed by a different letter are significantly different at p < 0.05. Error bars represent standard deviation values (n = 3).

