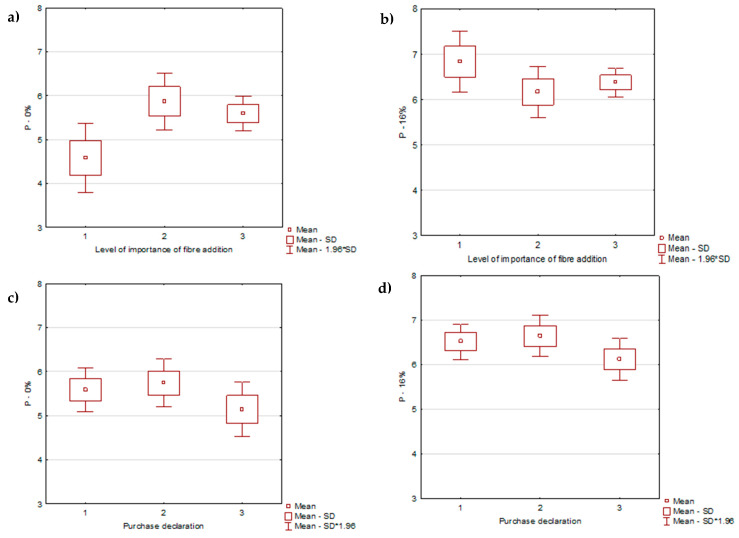
Figure 3.
Results distribution of the liking evaluation of cooked pasta samples. (a): P-0 (control sample) and (b): P-16 (16% oat β-glucan fiber powder) in relation to the declared importance of fiber addition; (c): P-0 (control sample) and (d): P-16 (16% oat β-glucan fiber powder) in relation to the willingness to purchase pasta; (1) the addition of fiber in pasta was important, (2) the addition was moderately important, (3) the addition was not important.

