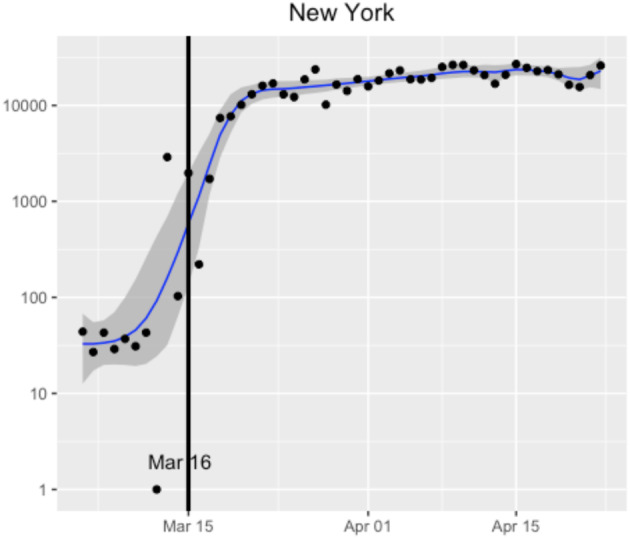
FIGURE 9.

The daily number of tests in New York State. The vertical black line indicates the intervention date. The blue line indicates a smoothed trend estimated by the dynamic shrinkage model (Kowal, Matteson, & Ruppert, 2019), with corresponding dark grey (credible) bands reflecting variability in the trend estimate
