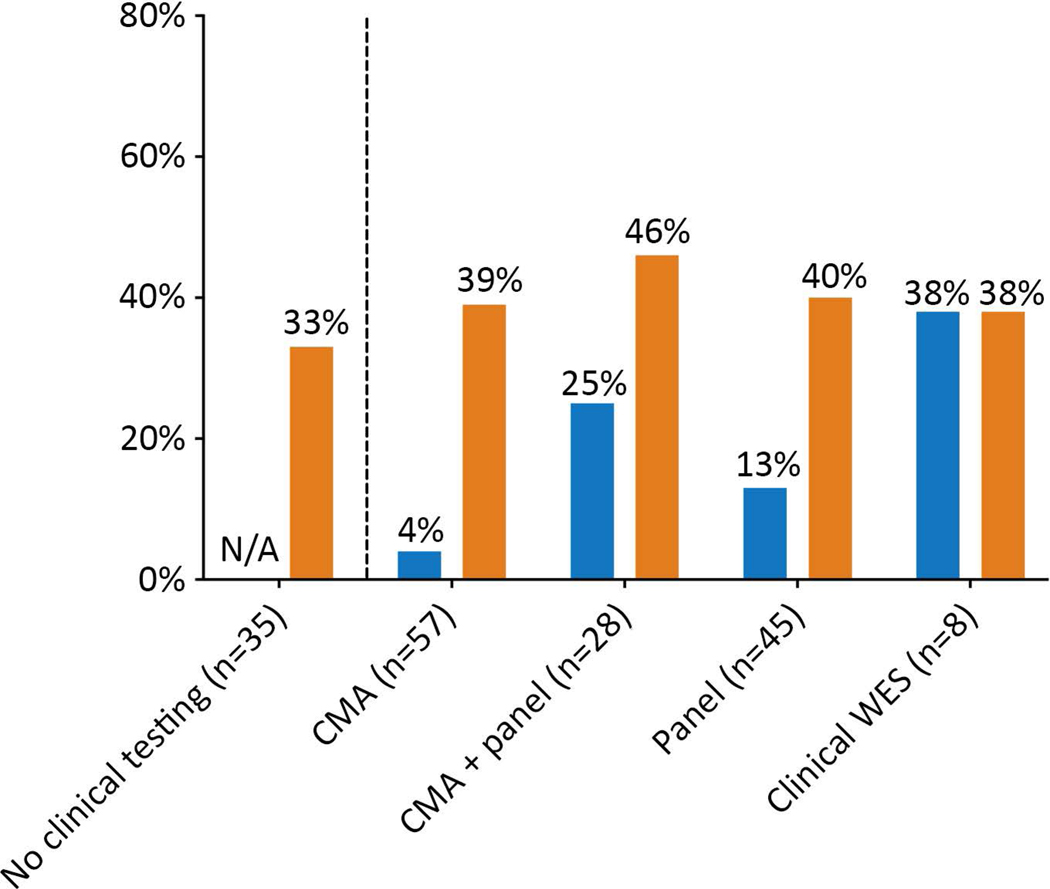
Figure 1: Diagnostic yield of research WES.
Diagnostic yield of research WES compared with diagnostic yield of prior/concomitant clinical genetic testing. CMA = chromosomal microarray; WES = whole exome sequencing. Blue represents the diagnostic yield from clinical testing and orange the diagnostic yield from research WES. Overall, 90 participants had at least one clinical genetic test. Since the type of clinical genetic testing that each participant had was variable and some participants had more than one genetic test, the total n represented by the categories in the figure does not add up to 90.

