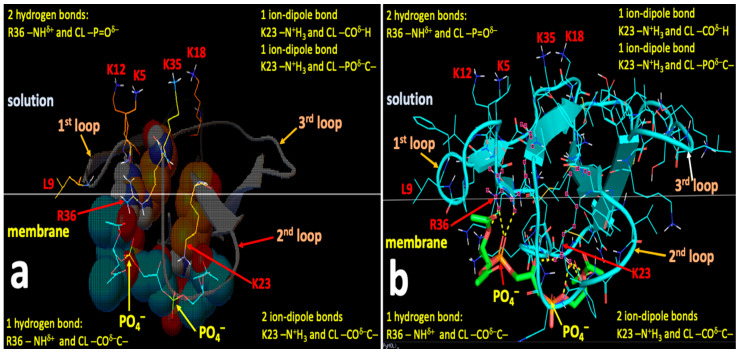
Figure 7.
Autodock (a) and Pymol (b) diagrams showing the interaction of CTII with the polar head of CL depicted as balls-cartoon-lines (CTII) and cartoon-sticks (CL) representations. CTII binds to the phospholipid membrane surface in a horizontal orientation by employing three loop tips of CTII facing the viewer. Carbon atoms of CL are presented in the Autodock diagram as emerald balls and in the Pymol diagram as green sticks. Atoms of amino acid residues interacting with CL are shown as balls and lines (Autodock) or pink squares (Pymol). Intermolecular bonds in the Pymol diagram are shown as yellow broken lines. Types of bonds are described in yellow letter sentences both in the Autodock and Pymol diagrams. Amino acid residues K5, K12, K18 and K35, which presumably bind phospholipids of a neighboring membrane, are shown as lines both in the Autodock and Pymol diagrams.

