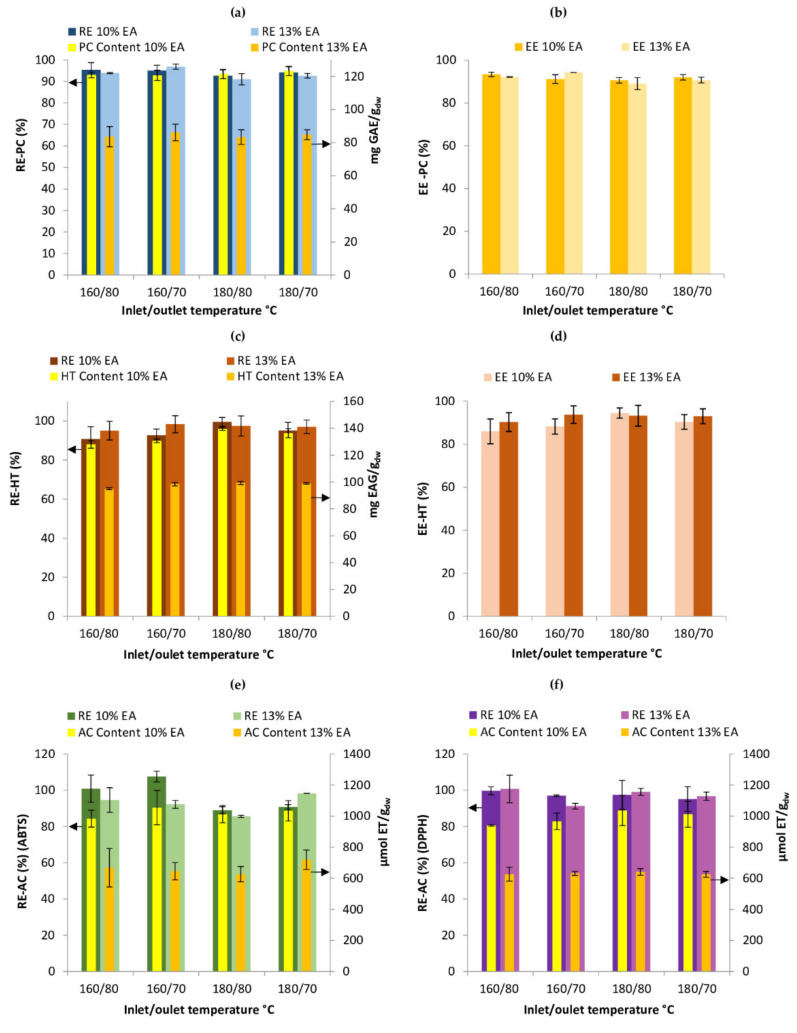
Figure 2.
Concentration, retention and encapsulation efficiency of bioactive compounds (BC) in microcapsules. (a) content and retention efficiency of PC; (b) encapsulation efficiency of PC; (c) content and retention efficiency of HT; (d) encapsulation efficiency of HT; (e) content and retention efficiency of AC (ABTS); (f) content and retention efficiency of AC (DPPH). Data are expressed as the mean ± standard deviation of the analysis in duplicate drying runs. The arrows indicate the axis to which the bars belong; RE: retention efficiency; EE: encapsulation efficiency; EA: encapsulating agents; PC: phenolic compounds; HT: hydrolyzable tannins; AC: antioxidant capacity.

