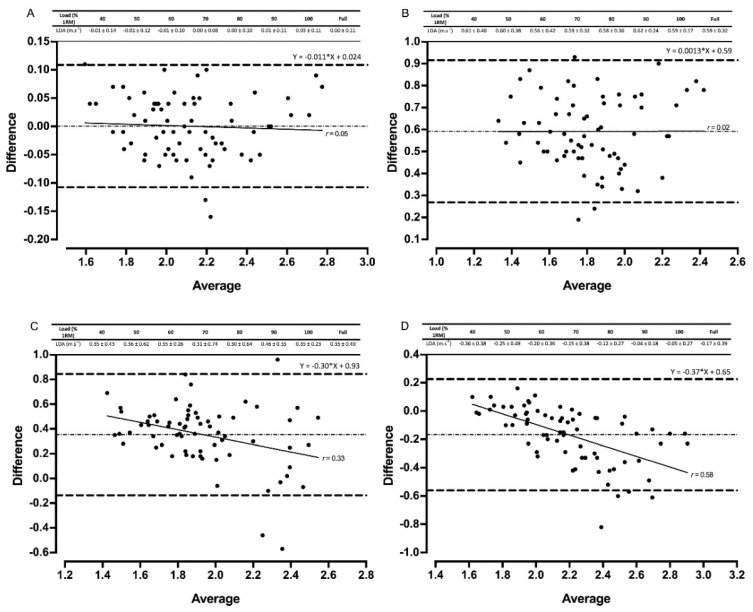
Figure 4.
Bland–Altman plots exhibiting variation in velocity-based devices versus 3D motion capture for full datasets for peak velocity in the power clean. The mean systematic bias (dash-dot line) and 95% confidence intervals (dashed line) are displayed with the regression line (solid line) and the r value. The table above displays the limits of agreement (LOA) ± 95 % confidence intervals for each relative load. Gymaware (A), PUSHbody (B), PUSHbar (C), and Bar Sensei (D) devices are all shown.

