
FIGURE 2.
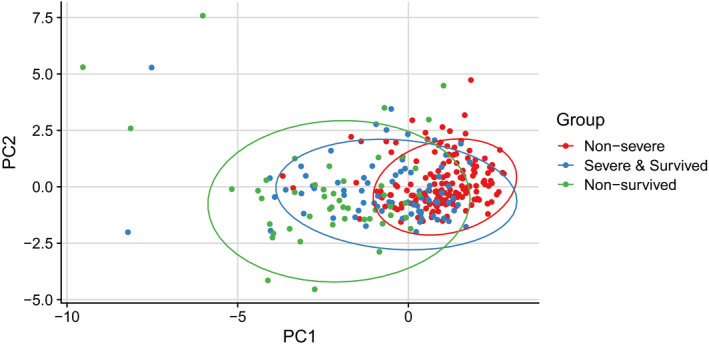
Principal Component Analysis (PCA). Principal Component Analysis (PCA) was used for dimensionality reduction and visualization of the patients. All patients were included in the analysis; parameters including laboratory results on admission, age, and affected lobe numbers were used in the analysis; results are represented by colored dots separated by three groups of severity. Despite no clear separation between the three groups, there was a clear trajectory from "nonsevere" toward "nonsurvived" via " survived severe"