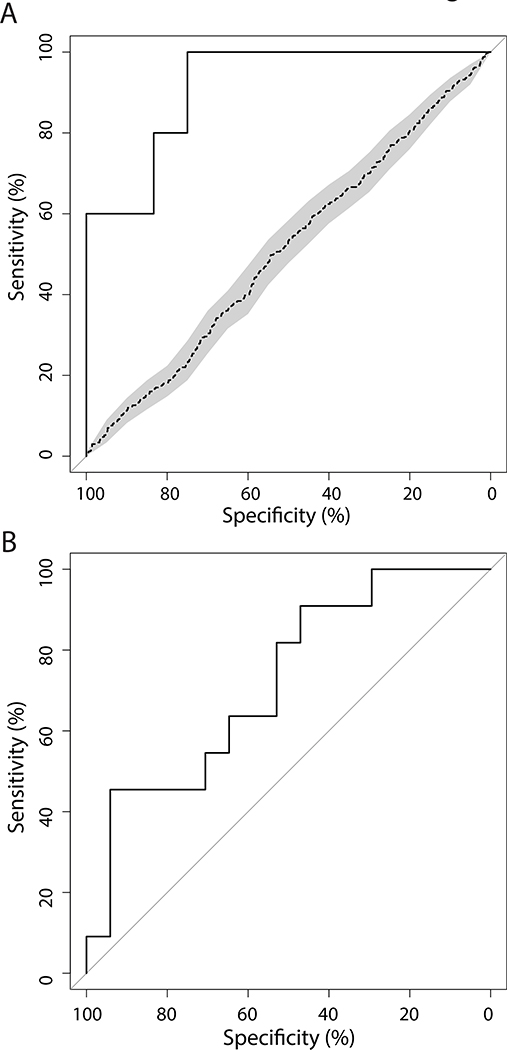
Figure 5. Performance of an airway biomarker in detecting the presence and progression of premalignant lesions.
The ROC curves demonstrate the biomarker performance. (A) ROC curve (AUC=0.92) showing biomarker performance based on predictions of the presence of PMLs in the validation samples (n=17), black line. Shuffling of class labels (n=100 permutations) produced an average ROC curve (dotted line) with a significantly lower AUC (p<<0.001). (B) ROC curve (AUC=0.75) showing biomarker performance based on changes in biomarker score over time in detecting PML regression or stable/progression.

