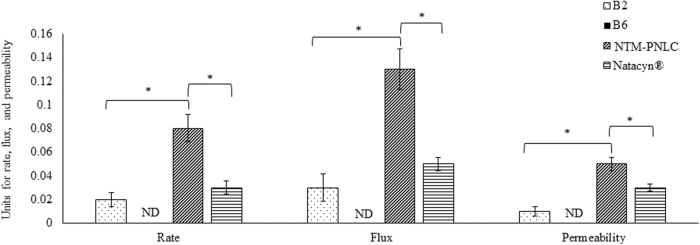
FIG. 2.
Plot of rate (μg/min), flux (μg/min/cm2), and permeability ( × 10−5 cm/s) for NTM permeation across the isolated cornea from NTM-PNLC-GEL-B2, NTM-PNLC-GEL-B6, NTM-PNLC, and Natacyn® (dose normalized: diluted to 0.3% w/v) over 3 h, (n = 3); data represented as mean ± standard error of mean. *Denotes statistically significant difference at P < 0.05.

