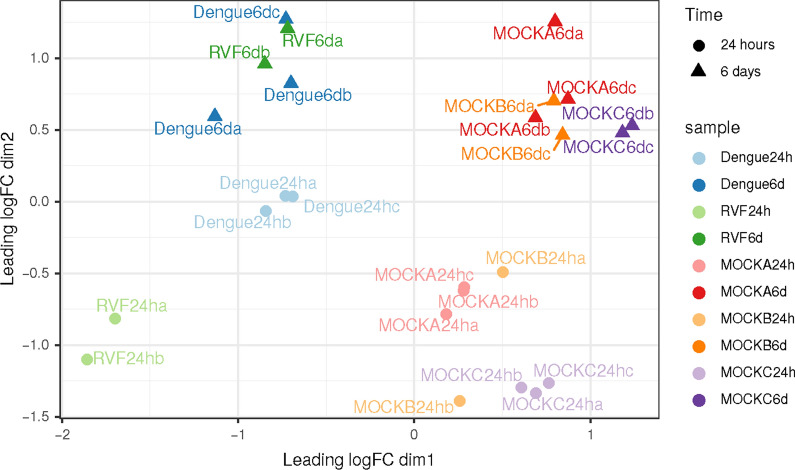
Fig. 1.
Non-parametric multidimensional scaling (MDS) plot of filtered samples. Each point represents a sample. Color represents the type of sample (RVF: Rift Valley fever). Mocks: negative controls of infections (see main text for description). Time post-infection is represented with shapes of different color intensity: clear circle for early responses (24 h); opaque triangles for late responses (6 days or 144 h). Points clustered in space share a similar expression pattern on a subset of 100 highly expressed genes. Fold changes in gene expression are projected on two dimensions (axes). The first axis separates viral and mock samples, the second axis separates early (24 h) and late (6 days) responses

