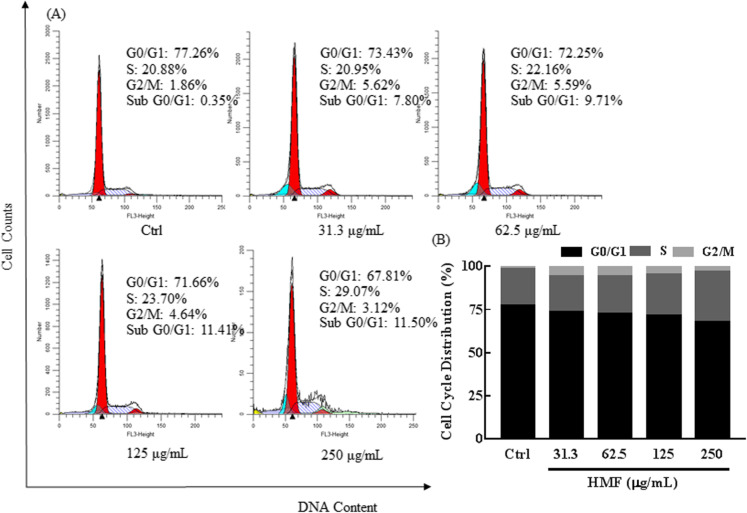
Fig. 3.
HMF increases S phase arrest in NCI-H1975 cell cycle distribution. a NCI-H1975 cells were exposed to different concentrations HMF (31.3–250 μg/mL) for 48 h. After treatment, the cells were collected, washed, fixed, and stained by propidium iodid (PI). Then, the cell cycle distribution was detected by flow cytometry, and the data were analyzed with ModFit LT software. Different colors were used to distinguish the peaks corresponding to cells in apoptosis, G0/G1, S, and G2/M phase. b The bar graph depicts the percentage of each cell cycle phase of NCI-H1975 cells in the absence or presence of HMF. All experiments were performed in three replicates

