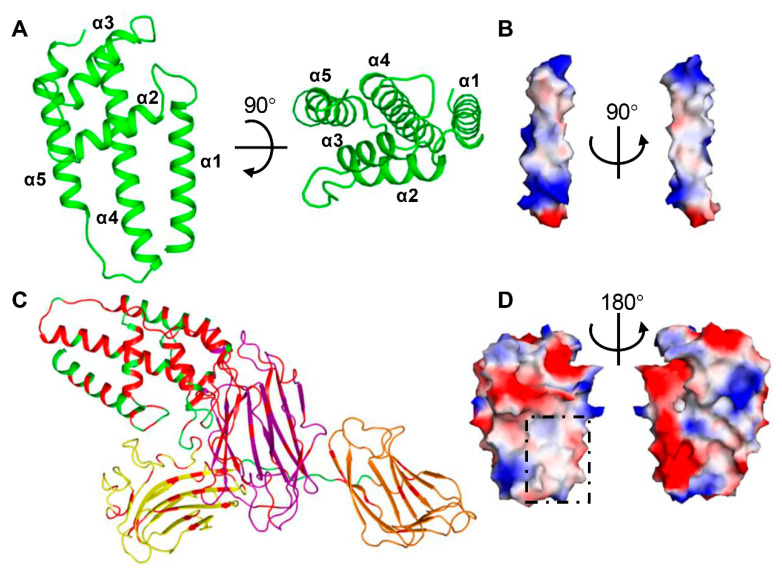
Figure 2.
Domain II of Vip3Aa11 shows a conserved hydrophobic surface. (A) Two views of structure of Vip3Aa11 domain II shown as a ribbon cartoon. (B) Two views of the surface model of helix α4 from domain II show its surface charge distribution. (C) The highly conserved amino acid residues from Vip3 family sequence alignment (Figure S1) are highlighted in the Vip3Aa structure with red color. (D) Two views of the surface model of Vip3Aa11 domain II show its surface charge distribution. The conserved hydrophobic surface is highlighted by black square. (B,D) The surface is colored as the basis of electrostatic potential with positive charged surface in blue and negatively charged area in red. The black arrow indicates the angle of rotation around the central axis.

