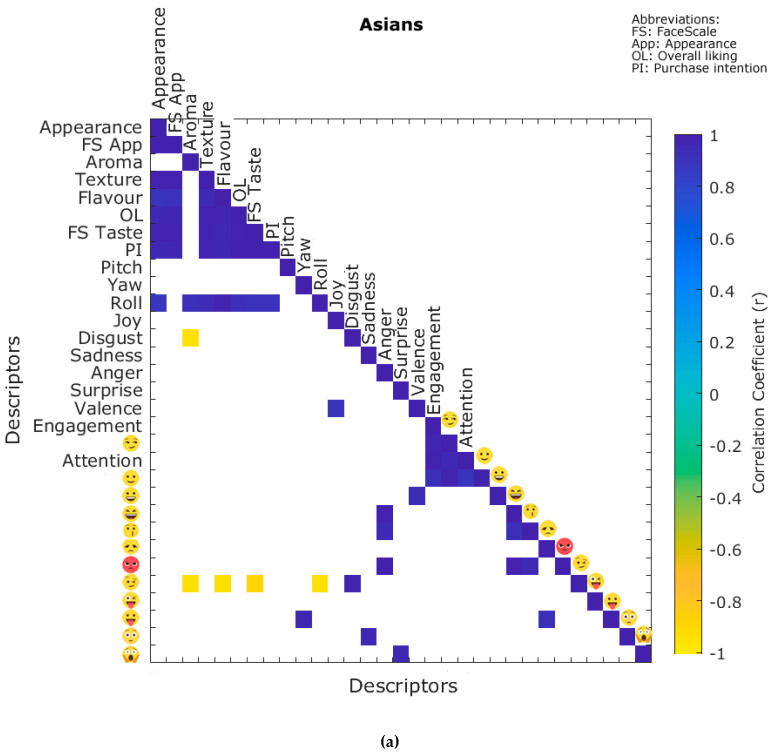
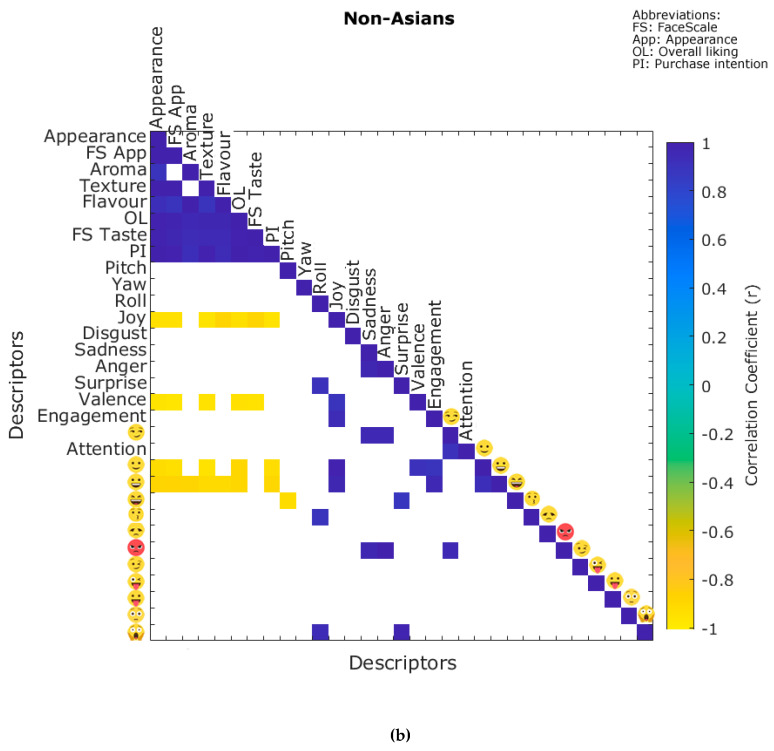
Figure 3.
Matrices showing the significant (p ≤ 0.05) correlations between the quantitative self-reported and biometric emotional responses for (a) Asians and (b) non-Asians. Color bar: blue side depicts the positive correlations, while the yellow side represents the negative correlations; likewise, darker blue and yellow denote higher correlations.


