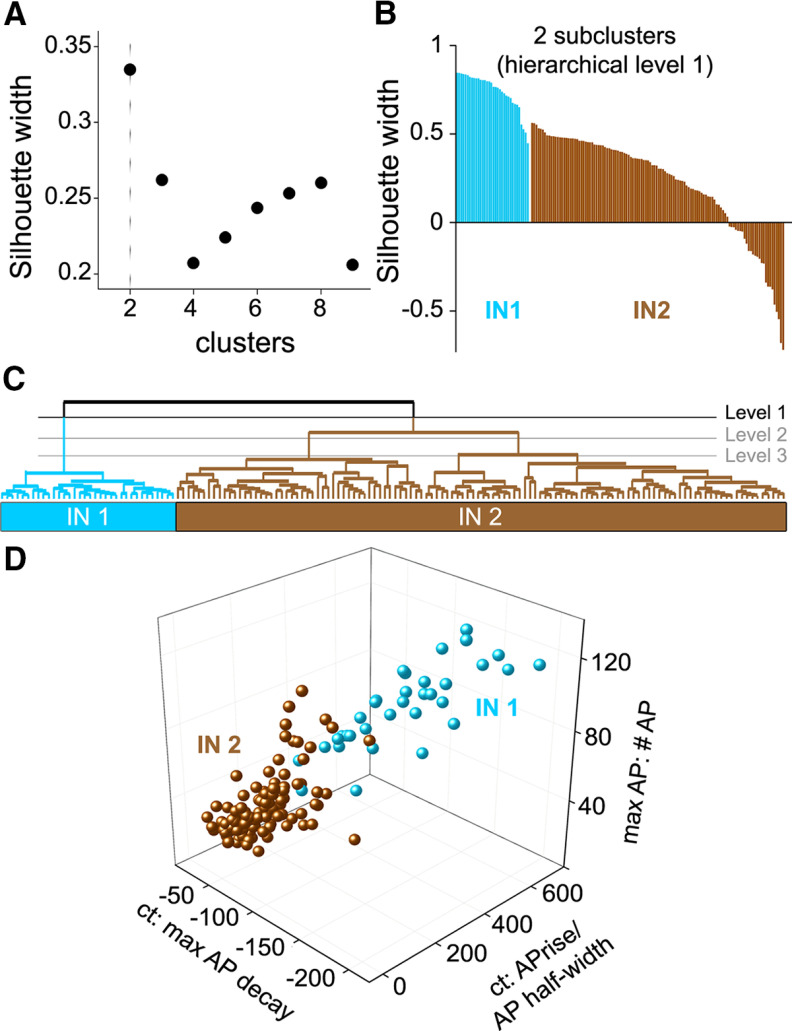
Figure 10.
Claustrum IN subtypes. A, Silhouette analyses were performed on data at several hierarchical levels to identify the optimal number of subclusters. The highest silhouette width (SI width) was obtained at hierarchical level 1, containing two clusters. B, SI width of single neurons within each of the two subclusters was ranked; the high SI widths of neurons in subcluster IN1 indicates clear separation from IN2, while the high variability of IN2 neurons indicates a heterogeneous subpopulation. C, Dendrogram of IN subtypes. D, Comparison of individual IN, showing the three features that differed the most between IN1 and IN2.

