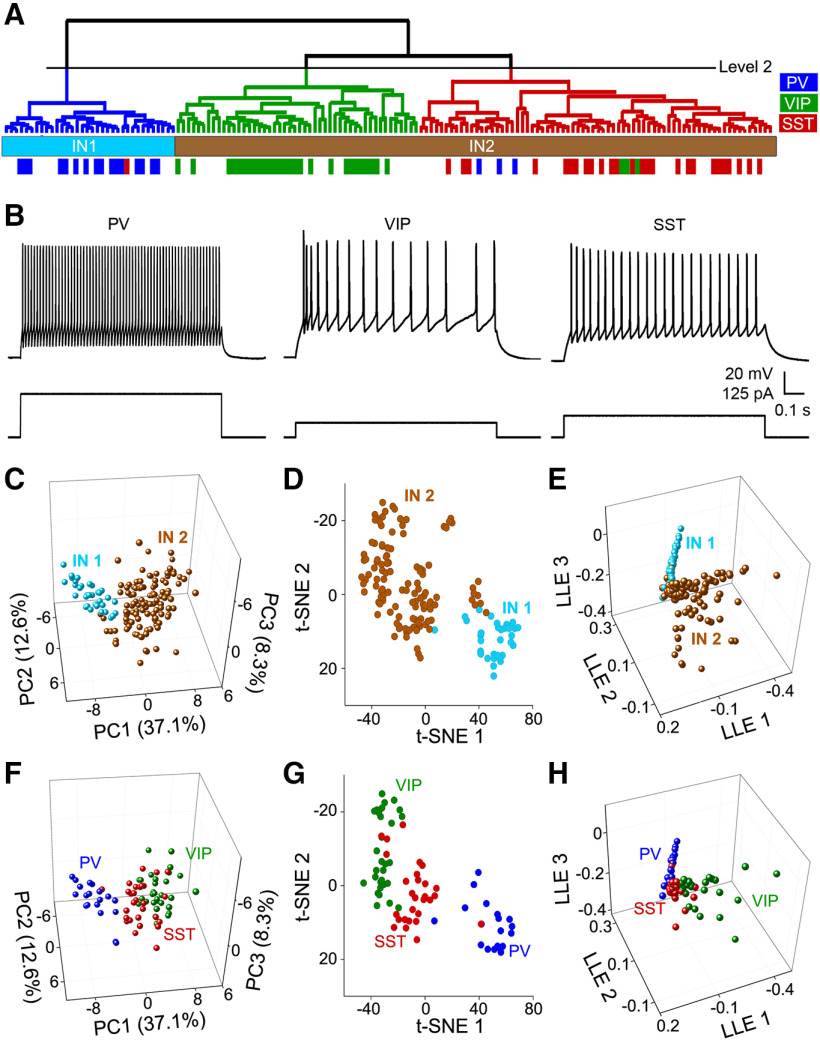
Figure 11.
Identification of claustrum IN subtypes. A, Dendrogram from Figure 10C, annotated with identified INs that expressed PV (blue), SST (red), or VIP (green). Neurons that expressed PVs were mostly clustered into IN1, identifying IN1 as PV-INs. Aside from a single SST-IN, all confirmed VIP-INs and SST-INs were in IN2, indicating that this subcluster consists of multiple IN subtypes. B, Representative examples of responses of the three different IN subtypes to depolarizing currents twice as high as the current threshold. C, Range of intrinsic electrical properties of claustral IN expressed by the first three PCs (PC1–3). Numbers in parentheses indicate the percentage of variance explained by the PC. D, E, Alternative IN clustering based on t-SNE (D) or LLE (E). Both alternative methods yielded subclusters that separated IN1 and IN2. F–H, Clustering of the same dataset shown in C–E, indicating neurons with PV (blue), SST (red), or VIP (green) expression. Clustering was done using PC analysis (F), t-SNE (G), or LLE (H), and all three approaches showed that IN subtypes differed in their intrinsic parameters and clustered into separate groups.

