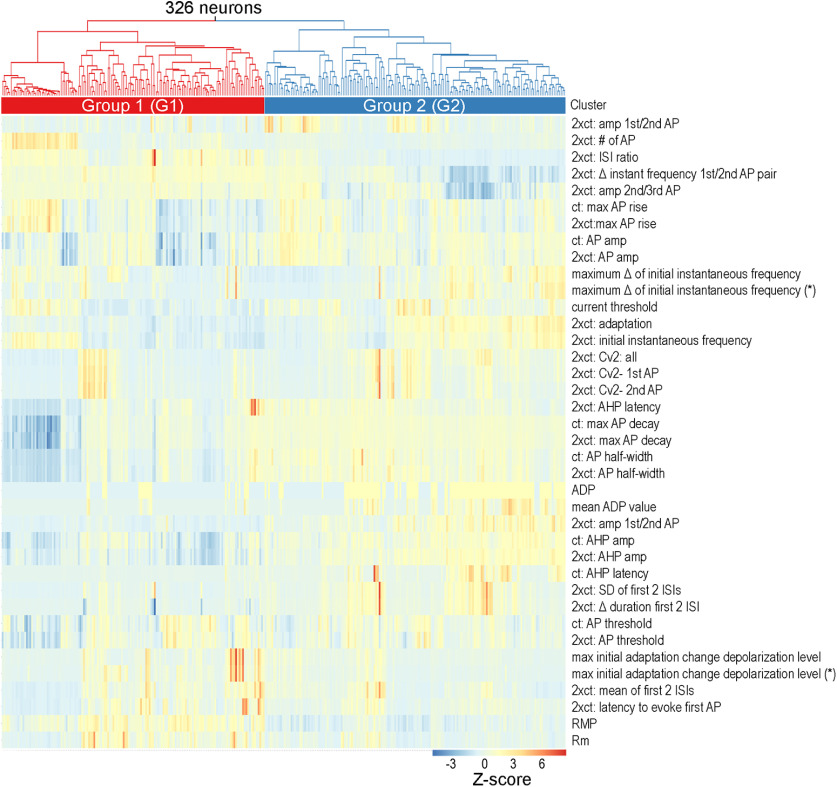
Figure 3.
Unsupervised clustering of claustral neurons based on their intrinsic electrical properties. Top, Properties of 326 claustrum neurons were used to generate a dendrogram. Single cells are located at the lowest branches, with more similar cells clustered in closer proximity. At the highest level of classification, cells were split into two main groups (red and blue). Bottom, Z-scores of extracted intrinsic properties (rows) are shown for each individual cell (column). Hot colors indicate high Z-scores, while cool colors indicate low Z-scores.

