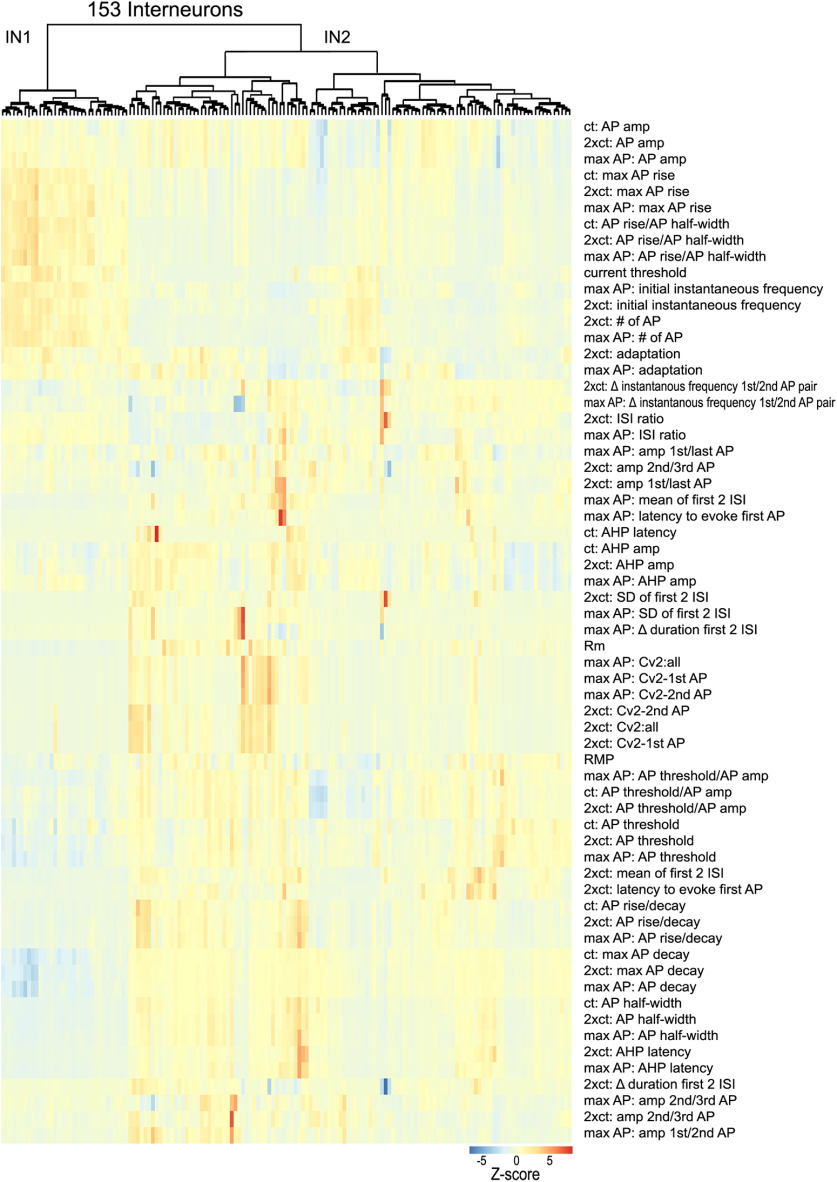
Figure 9.
Unsupervised clustering of claustrum IN. A total of 63 intrinsic electrical properties were analyzed for 153 INs at three different depolarization levels: ct, 2xct, and level that evoked maximal AP firing and then clustered in an unsupervised manner. Top, Dendrogram showing clusters of IN. Bottom, Z-scores of intrinsic properties (rows) are shown for each individual cell (column). Hot colors indicate high Z-scores, while cool colors indicate low Z-scores.

