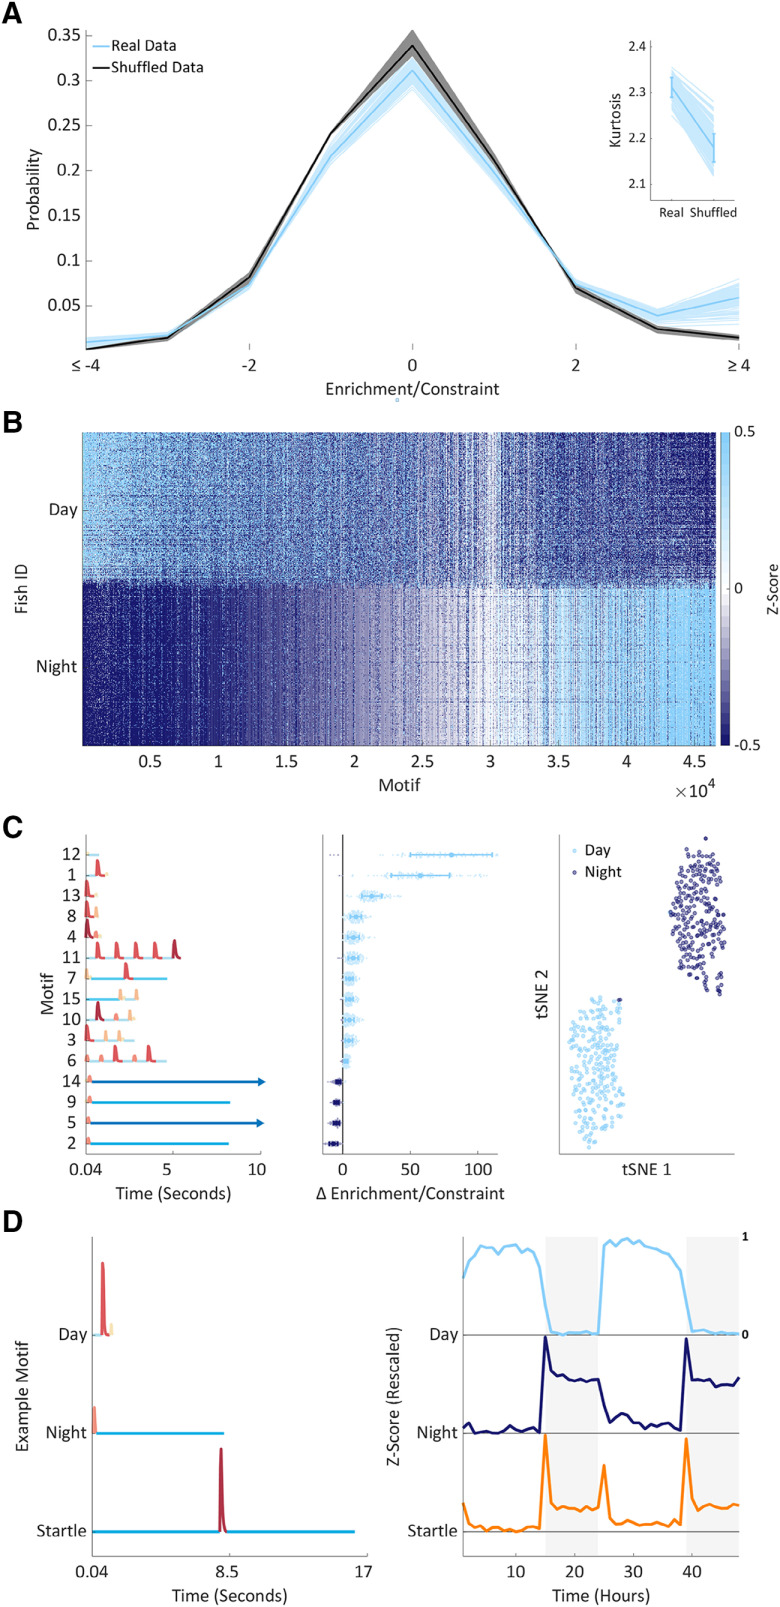
Figure 4.
Supervised learning identifies contextual behavioral motifs. A, pdfs showing the probability of observing motifs at different enrichment/constraint scores rounded to whole numbers and summed at values above or below ±4 for ease of visualization. Each wild-type animal is depicted by a single pale blue (real data) and 10 black (shuffled data) lines; overlaid in bold are mean pdfs. The inset shows that the kurtosis of the real data are higher than the shuffled data (p < 10−271; two-way ANOVA, real vs shuffled data, no significant interaction with experimental repeat factor). Each larva is shown as a pale line; overlaid is a population mean and SD. B, Enrichment/constraint scores for all 46,554 motifs (x-axis) for each fish during day/night 5 and 6 of development (y-axis). To emphasize structure, motifs are sorted in both axes, first by their average day/night difference (from day to night enriched left to right), then separately day and night by larva. Finally, each motif’s enrichment/constraint score is Z-scored to aid visualization. C, left, The 15 day/night mRMR motifs module sequences are shown numbered by the order in which they were selected by the algorithm. Motifs are sorted by day minus night enrichment/constraint score (middle). The long pauses at the end of motifs 5 and 14 are cropped at 10 s (arrows). Middle, For each selected motif (y-axis), ordered as in the left panel, each wild-type animal’s (124 in total) day minus night enrichment/constraint score (x-axis) is shown as a dot. Values above zero are colored light blue; below zero are dark blue. Overlaid is a population mean and SD per motif. Right, A tSNE embedding of the 15-dimensional motif data (middle) into a two-dimensional space. Each circle represents a single day (light blue) or night (dark blue) sample. D, Representative motif temporal dynamics; shown are motifs 1 (day) and 2 (night) from C, as well as a startle-like motif. Left, Each motif’s module sequence. Right, Each motif’s mean enrichment/constraint score each hour, rescaled to 0–1. Extended Data Figure 4-1 supports Figure 4.

