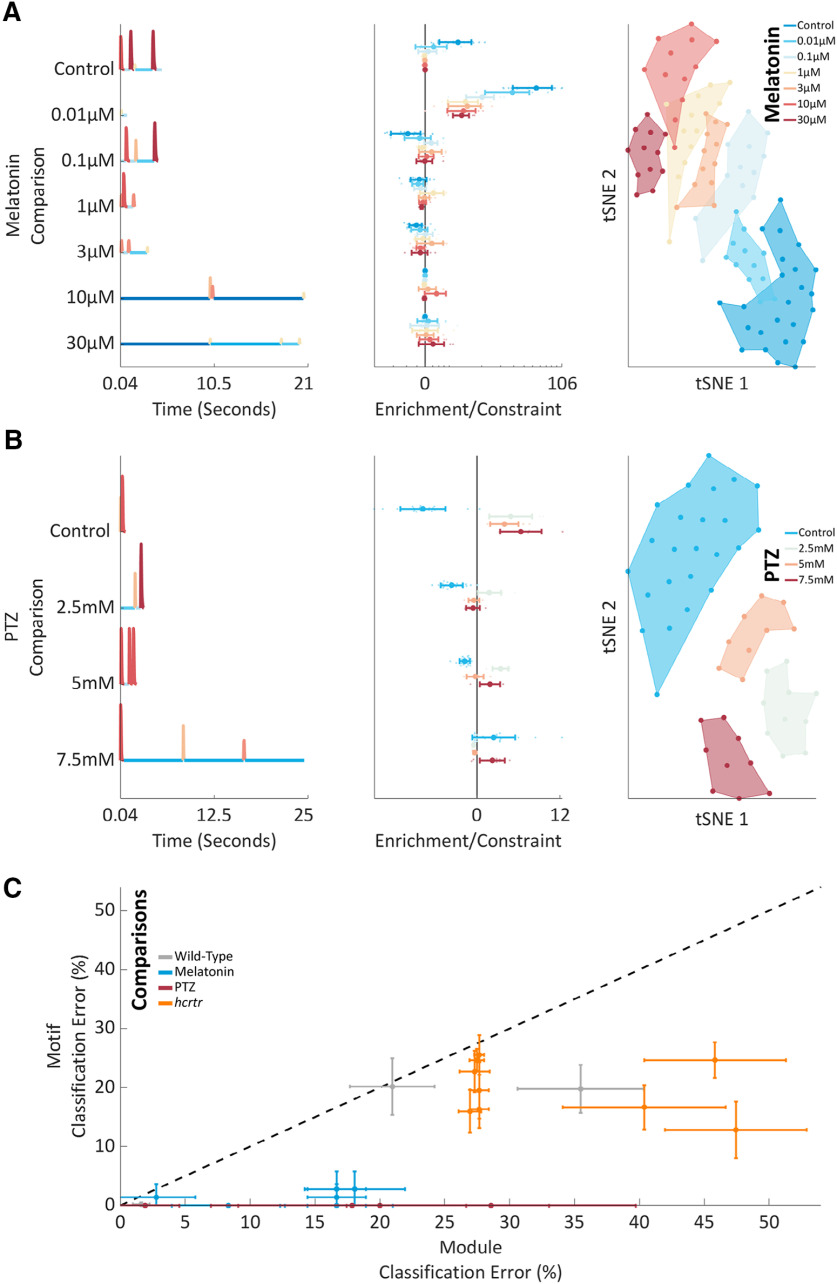
Figure 5.
Pharmacological behavioral motifs. A, left, Module sequences for the single best motif for each melatonin comparison. Modules are colored as elsewhere. Middle: for each dose’s single best motif, see left panel y-axis for dose, enrichment/constraint scores are shown for every dose on a log x-axis. Each animal is shown as a dot, with a mean ± std overlaid per dose. Right, A two-dimensional tSNE embedding from a space of 912 unique motifs. Each animal is shown as a single dot underlaid by a shaded boundary encompassing all animals in each condition. B, left, Module sequences for the single best motif for each PTZ comparison. To highlight a seizure specific motif, the control motif and corresponding enrichment/constraint score shown is mRMR motif 2, not 1, for this comparison. Modules are colored as elsewhere. Middle, For each dose’s single best motif, enrichment/constraint scores are shown for every dose on a linear x-axis. Each animal is shown as a dot, with a mean and SD overlaid per dose. Right, A two-dimensional tSNE embedding from a space of 338 unique motifs. Each animal is shown as a single dot underlaid by a shaded boundary encompassing all animals in each condition. C, Each classifier’s classification error (%) is shown in terms of modules (x-axis) and motifs (y-axis). Data are shown as mean and SD from 10-fold cross validation. Classifiers are colored by experimental dataset (see Legend). For reference, y = x is shown as a broken black line. Data below this line demonstrates superior performance of the motif classifiers.

