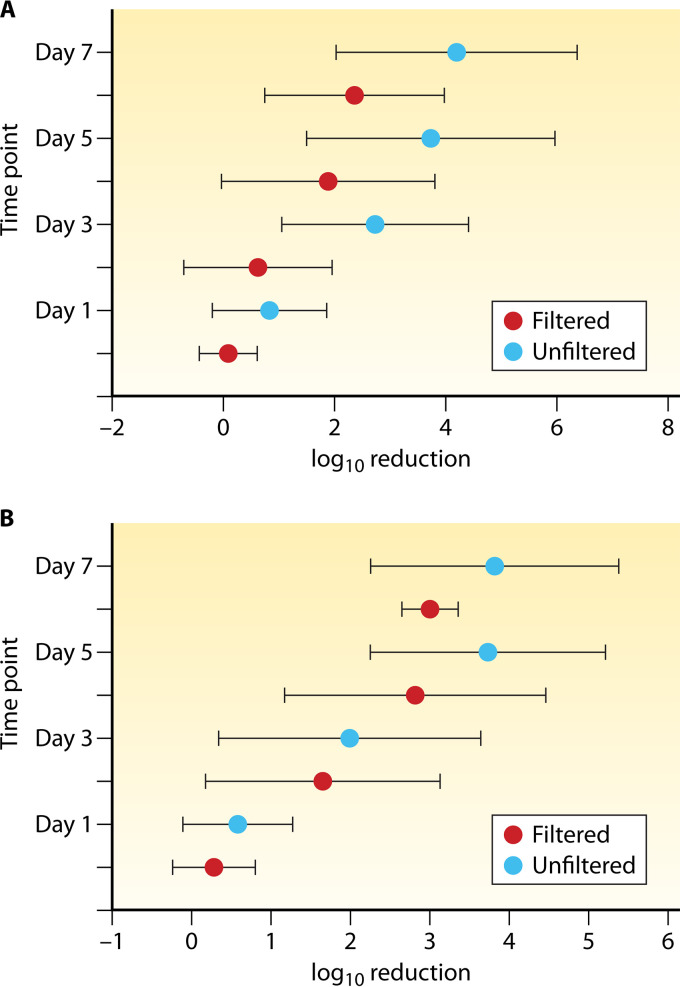
FIG 5.
Decay (log10 reduction) of culturable E. coli (A) and enterococci (B). Means ± standard deviations for aggregate values from several studies are shown for each time point of exposure to the indigenous freshwater and marine microbiota (blue symbols) or to filtered water with no indigenous microbiota (red symbols) (27, 28, 45, 122, 156).

