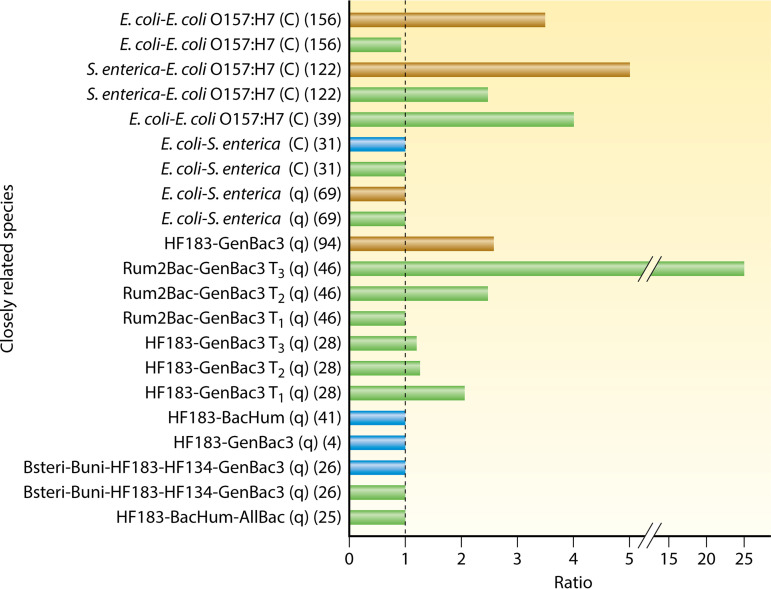
FIG 6.
Decay ratio of closely related species in marine water (blue bars), freshwater (green bars), and sands/sediments (brown bars). The dashed line represents a ratio of 1 (no difference in decay rates); values of >1 indicate that the first target decayed more rapidly than the second. Citations for individual studies are provided in parentheses (including references 4, 25, 26, 28, 31, 39, 41, 46, 69, 94, 122, and 156). C, culture-based measurements; q, molecular (e.g., qPCR) measurements; Tn, measurements at multiple time points within a study.

