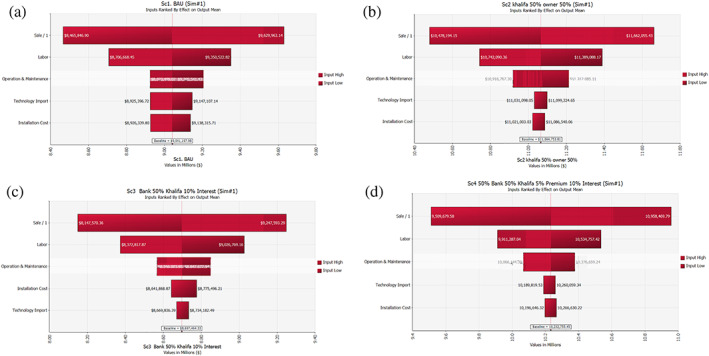
FIGURE 5.

(a) Tornado graph showing the NPV sensitivity in dollars after eliminating the cost of renting land in Scenario 1. (b) Tornado graph showing the NPV sensitivity in dollars after eliminating the cost of renting land in Scenario 2. (c) Tornado graph showing the NPV Sensitivity in dollars after eliminating the cost of renting land in Scenario 3. (d) Tornado graph showing the NPV Sensitivity in dollars after eliminating the cost of renting land in Scenario 4 [Colour figure can be viewed at wileyonlinelibrary.com]
