
Fig 3.
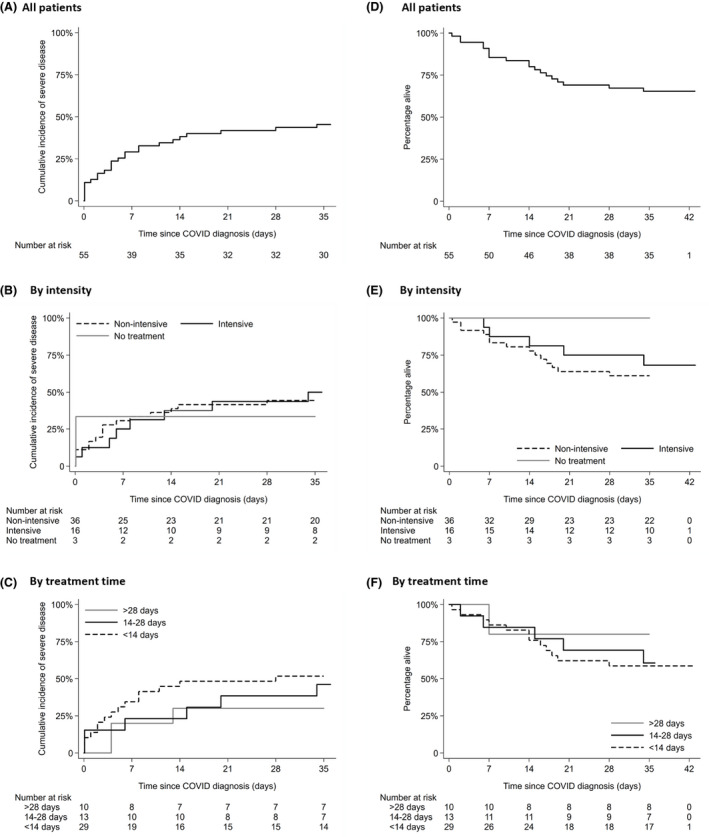
Cumulative incidence of event (severe disease) for (A) whole cohort, (B) by treatment group (intensive/non‐intensive) and (C) by treatment time. Patients who had recovered without severe disease were recorded as not having an event and last follow‐up time was censored at day 35 (the day after last reported COVID severe event in the cohort). (D) Kaplan–Meier survival curve of the whole cohort, (E) treatment intensity and (F) treatment time. Patients who had recovered were censored at day 35 (the day after the last reported COVID death). [Colour figure can be viewed at wileyonlinelibrary.com]