
FIGURE 1.
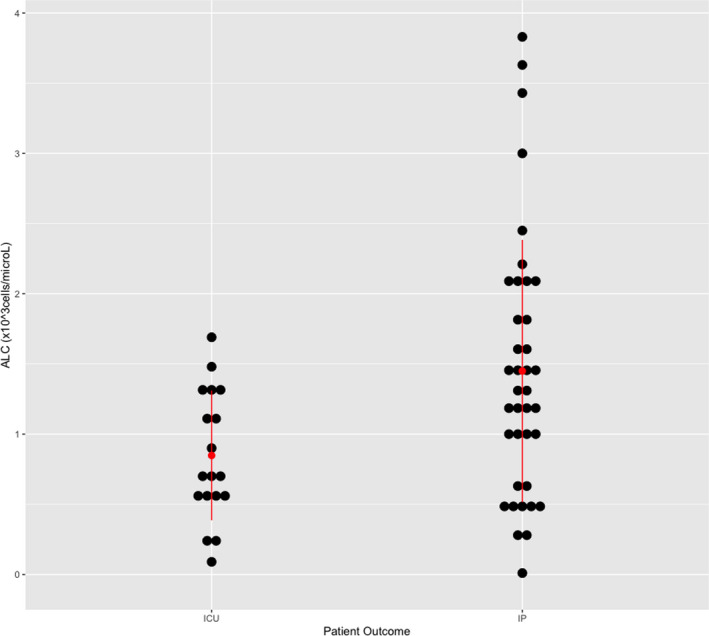
Scatter plot for Absolute Lymphocyte Count (ALC)‐based ICU admission status (patient outcome). Red bars represent standard deviation, and red dot represents the mean. Data points are represented by black dots. Abbreviations: ICU, patients admitted to the Intensive Care Unit; IP, patients admitted to the In‐Patient unit, not the ICU