
Fig. 3.
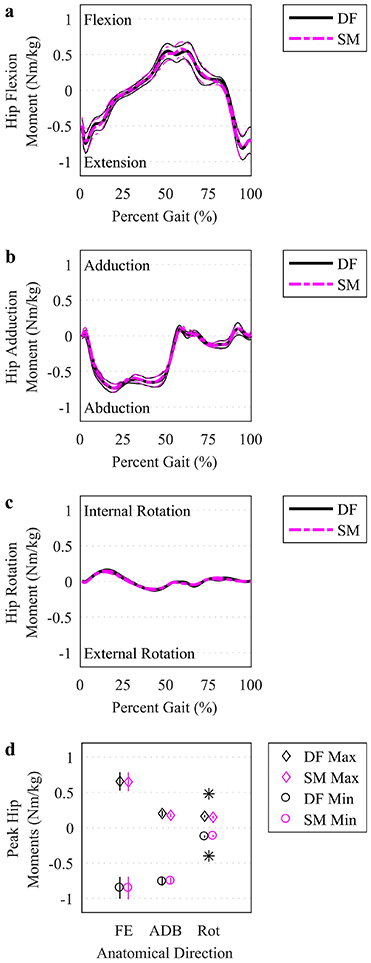
Hip joint moments. (a-c) The mean (thicker lines) and ± 95% CI (thinner lines) hip joint moments were plotted for simulations based on DF (solid, darker lines) and SM (lighter, dashed lines) IK solutions over the time-normalized gait cycle. (d) Peak moments (maximum and minimum) in each anatomical direction were plotted at the mean (symbols, see legend) with a vertical line representing ± 95% CI. An asterisk indicates a significant difference between DF and SM using a paired t test (p<.05). FE: flexion/extension. ADB: adduction/abduction. Rot: internal/external rotation.