
Fig. 5.
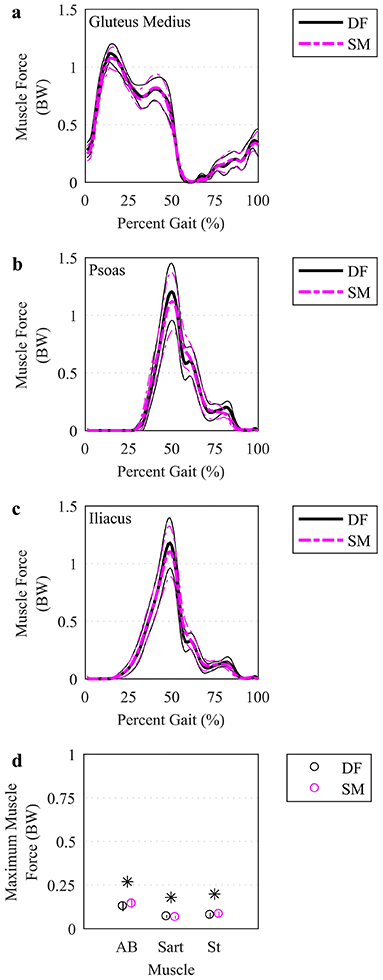
Simulated forces for select muscles. (a-c) The mean (thicker lines) and ± 95% CI (thinner lines) muscle forces were plotted for simulations based on DF (solid, darker lines) and SM (lighter, dashed lines) IK solutions over the time-normalized gait cycle. The three muscles with the largest time-integral of muscle force were plotted. (d) Maximum muscle forces were plotted at the mean (circles) with a vertical line representing ± 95% CI. Only the muscles with a significant difference using a paired t test, indicated by an asterisk (p<.05), between DF and SM were plotted. BW: body weight. AB: adductor brevis. Sart: Sartorius. Il: iliacus. St: semitendinosus.