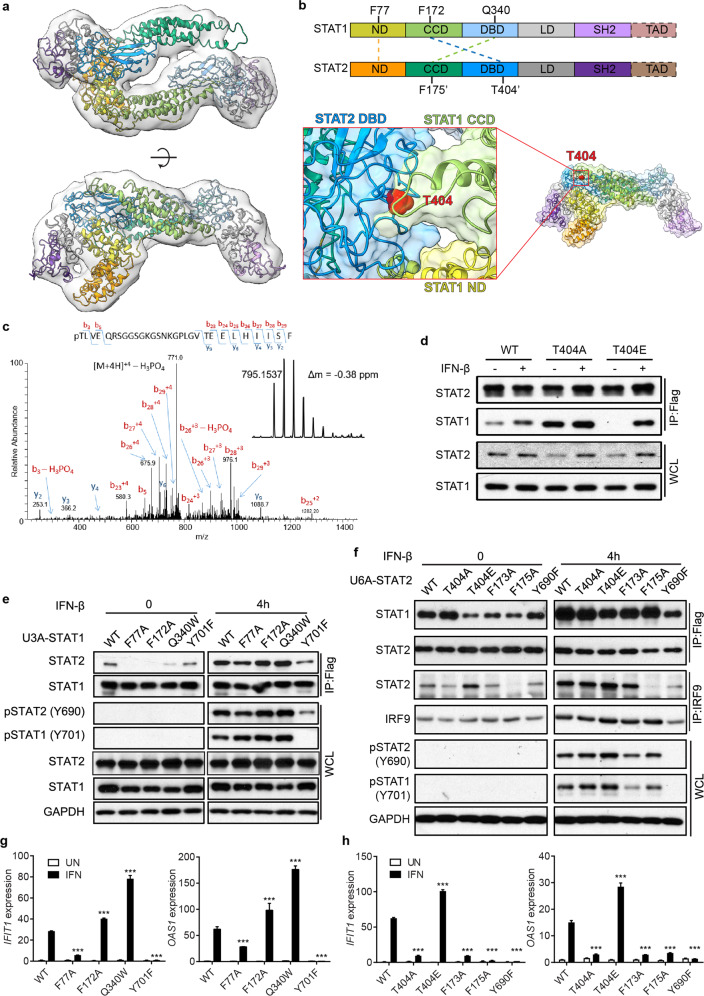
Fig. 1. Phosphorylation of STAT2 on T404 disrupts the U-STAT1-U-STAT2 dimer, a negative regulator of IFN-I-dependent signaling.
a EM density at contour level of 1.81 shown in transparent surface. Proteins are depicted as cartoon models. b Schematic diagram showing the key residues for STAT1-STAT2 dimer, and close-up view of T404 in STAT1-STAT2 interface. c MS/MS spectra for the phosphorylated chymotryptic peptide pTLVEQRSGGSGKGSNKGPLGVTEELHIISF. This quadropoly charged peptide has an observed m/z of 795.1537 Da and is within −0.38 ppm of the expected mass. This spectrum is dominated by H3PO4 loss, consistent with the presence of a phosphorylated S or T residue. The masses of the b3 and b5 ions are consistent with phosphorylation at T404. d STAT2-null U6A cells expressing WT, T404A, or T404E STAT2 were treated with IFN-β (100 IU/mL) for 30 min or untreated. Whole-cell lysates were used for immunoprecipitations of Flag-STAT2. e STAT1-null U3A cells expressing WT, F77A, F172A, Q340W, or Y701F STAT1 were treated with IFN-β (100 IU/mL) for 4 h or untreated. Whole-cell lysates were used for immunoprecipitations of Flag-STAT1, and analyzed by western blot. f U3A cells expressing WT, F77A, F172A, Q340W, or Y701F STAT1 were treated with IFN-β (100 IU/mL) for 4 h or untreated. Total RNAs were analyzed by qRT-PCR. g U6A cells expressing WT, T404A, T404E, F173A, F175A, or Y690F STAT2 were treated with IFN-β (100 IU/mL) for 4 h. Whole-cell lysates were used for immunoprecipitations of Flag-STAT2 or IRF9 and analyzed by western blot. h U6A cells expressing WT, T404A, T404E, F173A, F175A, or Y690F STAT2 were treated with IFN-β (100 IU/mL) for 4 h or untreated. Total RNAs were analyzed by qRT-PCR. Data are shown as means ± SEM from three independent experiments. P values were calculated using the paired ratio t-test (mutants vs WT, ***P < 0.001).

