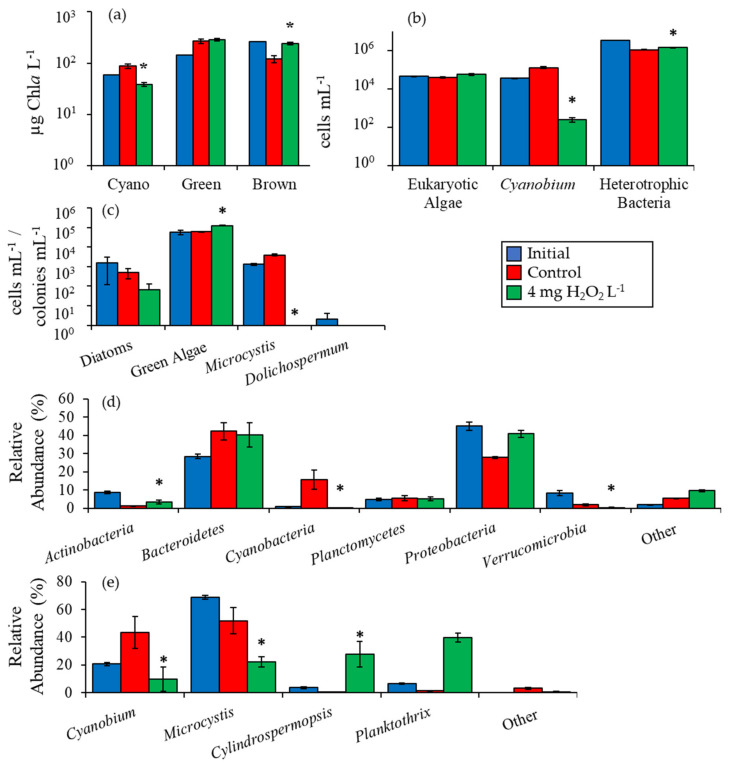
Figure 6.
(a) Fluoroprobe biomass, (b) flow cytometry, (c) microscopy, (d) phylum level relative abundance, and (e) genus level cyanobacteria relative abundance for Roth Pond experiment, 6/30/17. Asterisks show significant changes (p < 0.05) in treatments relative to control. Error bars show standard error.

