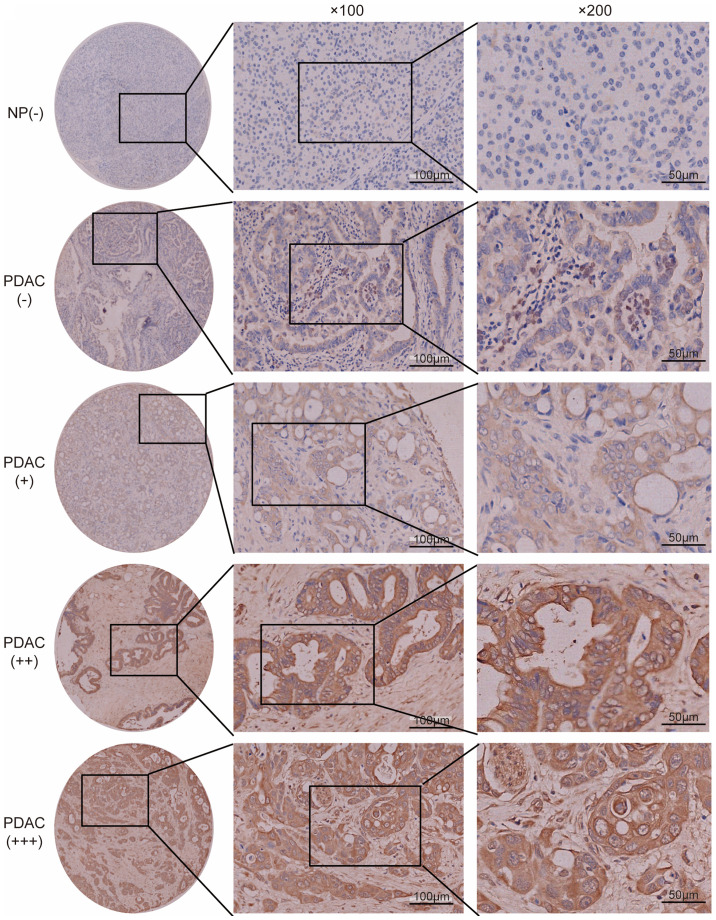
Figure 3.
Expression level of FGF2 in PDAC tissue. Representative images of immunohistochemical staining of FGF2 in NP and PDAC tissue (magnification, ×100 and ×200, respectively. Representative images of FGF2 were classified as negative (−), weak (+), moderate (++) or strong staining (+++). NP, normal pancreas; FGF2, fibroblast growth factor 2; PDAC, pancreatic ductal adenocarcinoma.

