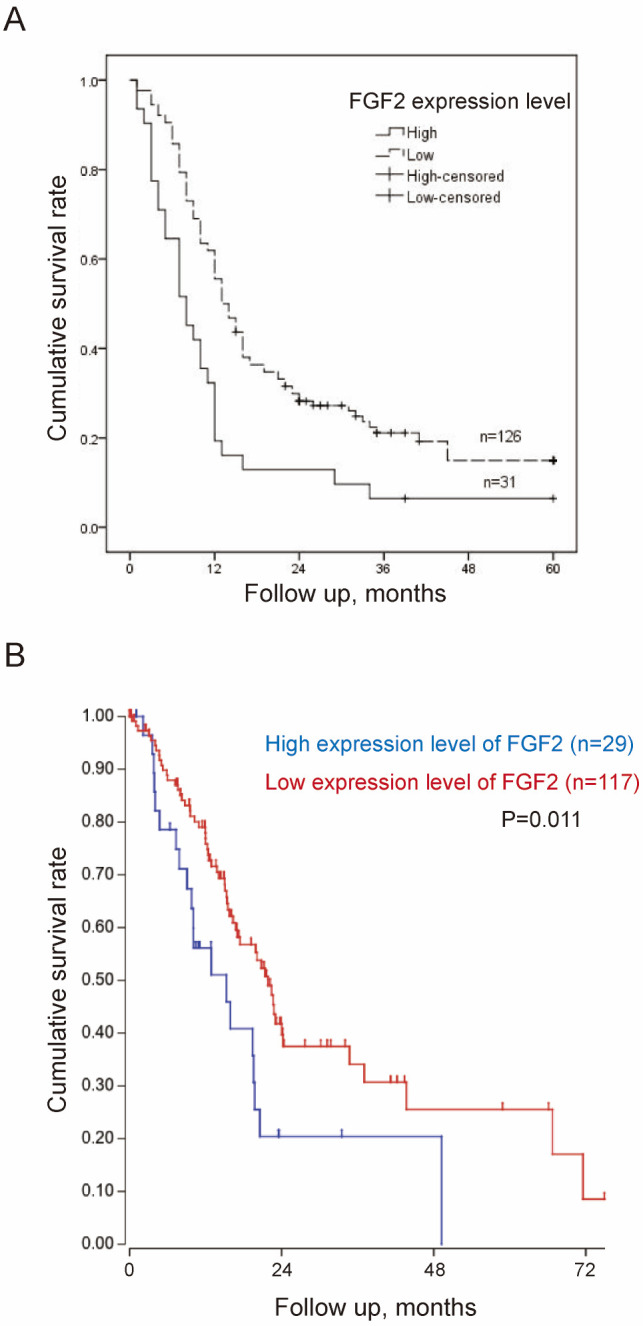
Figure 4.

Expression levels of FGF2 and OS (A) Kaplan-Meier survival curves demonstrating that OS of patients with high expression levels of FGF2 was significantly shorter vs. patients with low expression levels of FGF2. (B) Kaplan-Meier survival curves demonstrating that OS of patients with high expression levels of FGF2 was significantly shorter compared with patients with low expression levels of FGF2 in The Cancer Genome Atlas cohort. 146 patients were followed up. A total of 32 out of 178 patients were excluded due to incomplete follow-up data. OS, overall survival; FGF2, fibroblast growth factor 2.
