
FIGURE 1.
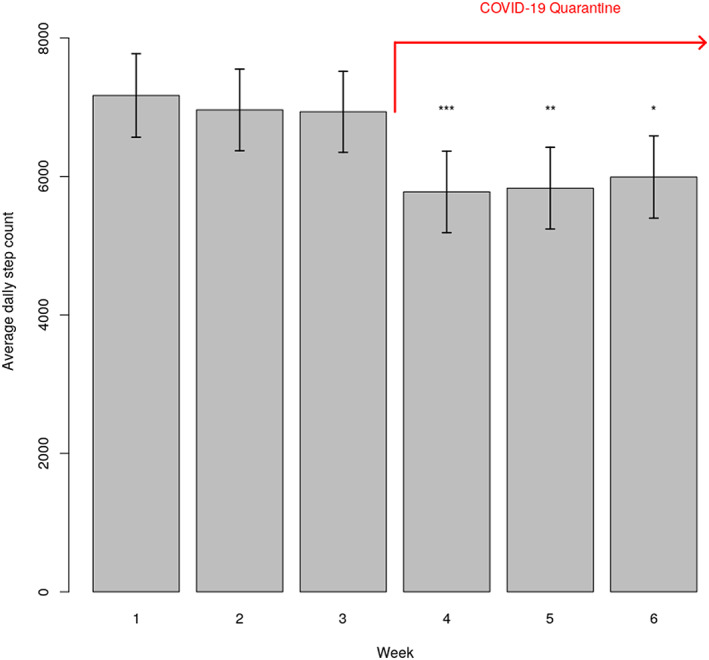
Average daily step count (± standard error) during 3 weeks preceding the onset of the quarantine (Weeks 1–3) and the first 3 weeks during the quarantine (Weeks 4–6). *** P < 0.001 for comparison with Weeks 1–3; ** P < 0.001 for comparison with Week 1 and P < 0.01 for comparison with Weeks 2 and 3; and * P < 0.01 for comparison with Weeks 1 and 2 and P < 0.05 for comparison with Week 3.