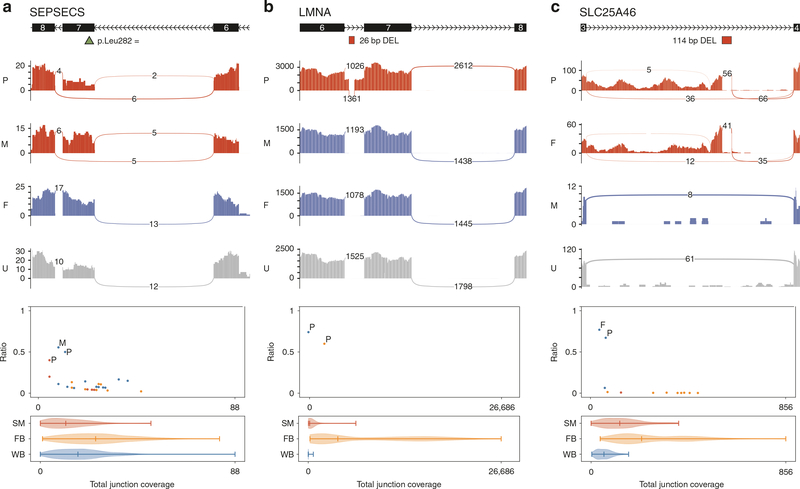
Fig. 2. Sashimi plots and noncanonical junction coverage ratio plots.
a SEPSECS exon skipping. b LMNA intron retention. c SLC25A46 intron retention and intronic pseudoexon inclusion. For the sashimi plots, the exon coverage and the splice junctions for the family members carrying the genomic variant are in red, for the family members not carrying the genomic variant are in blue, and for the unrelated individuals not carrying the genomic variant are in gray. Canonical exons and the genomic variants are shown above the respective sashimi plots with the exon number and the transcription direction indicated. For the noncanonical junction coverage ratio plots, the x-axis is the total number of reads at the junction (sum of canonical and noncanonical junctions) and the y-axis is the noncanonical junction coverage ratio (noncanonical junction coverage/total junction coverage). Family members carrying the noncanonical junctions are noted by P (proband), M (mother), or F (father) in respective color of the tissues observed and unrelated individuals carrying the noncanonical junctions are noted in dots in respective color of the tissues observed (blue: blood; yellow: fibroblast; red: muscle). Below each plot is a violin plot showing the coverage distribution from all samples at each junction for different tissues (FB fibroblast, SM muscle, WB blood).

