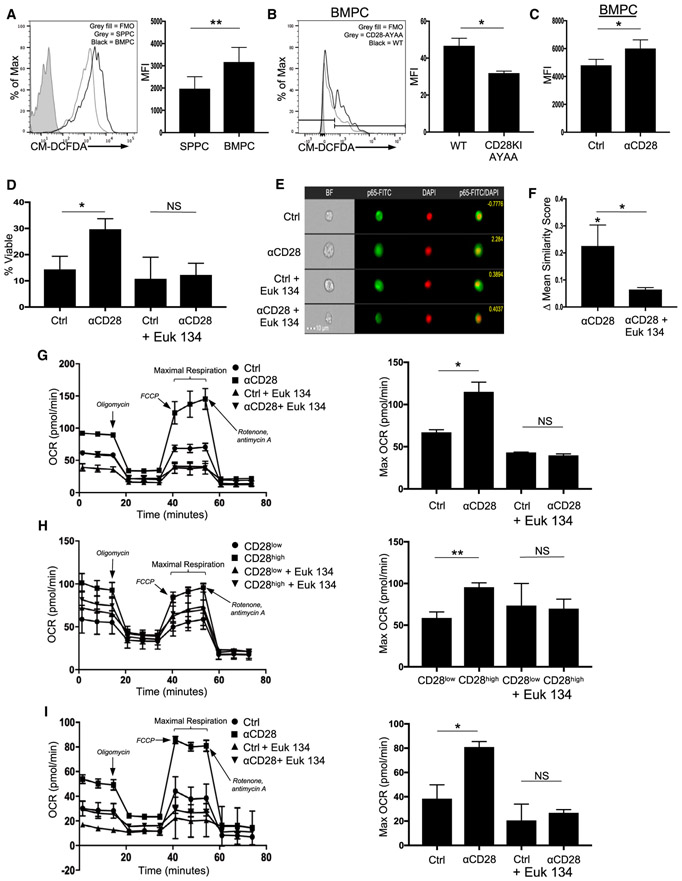
Figure 6. CD28 Induces ROS for BMPC Survival.
(A) WT BM and SP MNCs were stained for CD138, B220, and cellular ROS with CM-DCFDA and analyzed using flow cytometry. Quantification represents raw MFI values for BM and SP PCs from individual mice pooled from three independent experiments. **p < 0.01.
(B) BM MNCs from two WT and CD28-AYAA mice were evaluated for ROS levels as in (A). *p < .05.
(C) BM and SP MNCs were treated with isotype control or anti-CD28 × 2 h in serum-free media and then stained for B220 CD138 and CM-DCFDA. Data are representative of three independent experiments. *p < .05.
(D) Purified BMPCs and SPPCs were treated with isotype control or anti-CD28 mAb × 16 h in serum-free media ± Euk 134. Survival was determined using trypan blue exclusion. Data are representative of three independent experiments. *p < .05.
(E) Purified BMPCs and SPPCs were treated with isotype control or anti-CD28 mAb ± Euk 134 × 30 m, stained for NF-κB RelA/p65 and DAPI, and analyzed using ImageStream for nuclear localization. Scale bar represents 10 μM.
(F) Change in ImageStream similarity score for NF-κB RelA/p65 nuclear localization with CD28 activation versus control (statistics above first bar) or CD28 activation ± Euk 134. Data pooled from three independent experiments. *p < .05.
(G) J558 cells were treated with isotype control or anti-CD28 mAb × 16 h in full serum ± Euk 134, and oxygen consumption rate (OCR) was determined using the Seahorse XF. Quantification is representative of maximal respiration. Data are representative of three independent experiments. *p < .05.
(H) CD28high and CD28lowXXO cells were plated × 16 h in full serum ± Euk 134, and OCR was measured as above. Data are representative of three independent experiments. Quantification is representative of maximal respiration. **p < 0.01.
(I) MM.1S cells were treated with isotype control or anti-CD28 mAb × 16h ± Euk 134, and OCR was evaluated as above. Quantification is representative of maximal respiration. Data are representative of two independent experiments. *p < .05.
Statistical analysis by Student’s t test, except for survival experiments, which were analyzed using ANOVA with Bonferroni analysis. Error bars represent ± SD.

