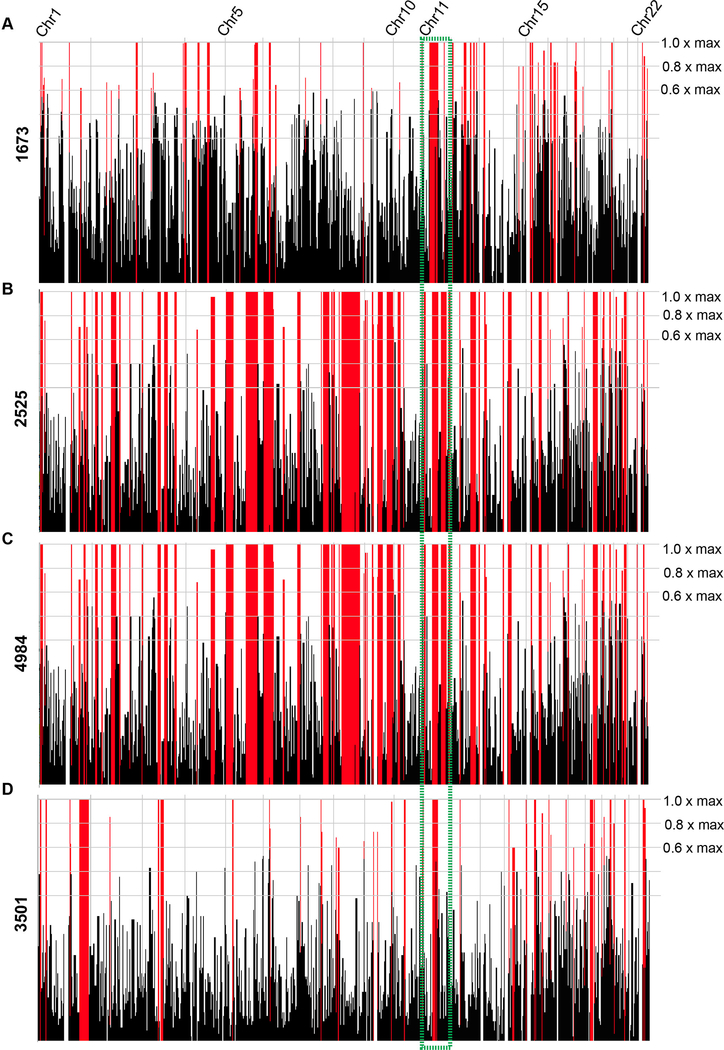
Figure 3. Homozygosity plots for all four families display homozygosity surrounding the TMX2 gene.
(A-D) Graphical representation of regions of homozygosity, generated by HomozygosityMapper for all 22 autosomes for the affected individual in Family 1673 (III-1, A), one affected individual from Family 2525 (III-2, B), one affected individual from Family 4984 (III-3, C), and both affected individuals from Family 3501 (III-6 and III-7, D). Red peaks indicate homozygosity scores above the given cutoff at 0.8x of the maximum. All plots show a region of homozygosity containing the TMX2 gene (green box).

