Figure 3.
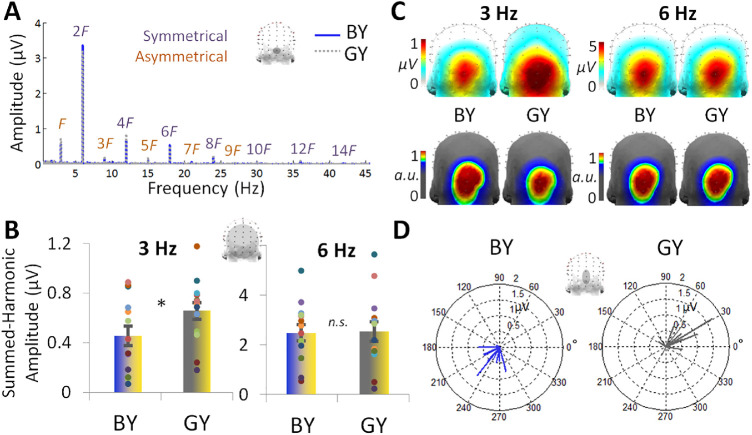
Experiment 2 EEG responses for the blue-yellow (BY) and gray-yellow (GY) pairs (n = 14). (A) As in Figure 2 of Experiment 1, channel OIz is plotted in the baseline-subtracted amplitude frequency domain. (B) Responses were quantified at the occipitoparietal ROI over the labeled harmonic frequencies for each the asymmetrical 3 Hz and symmetrical 6 Hz responses shown in Part A. Individual data are shown with dots, paired by color. (C) The topographical distributions of the summed-harmonic baseline-subtracted data as shown in Part B, for 3 and 6 Hz (top row). The corresponding normalized topographies are shown below (bottom row). (D). The 3 Hz phase over the average of POz, Oz, and OIz. Individual participant data is plotted in separate vectors, with the angle representing the cosine phase and the length representing baseline-subtracted amplitude over these channels at 3 Hz.

