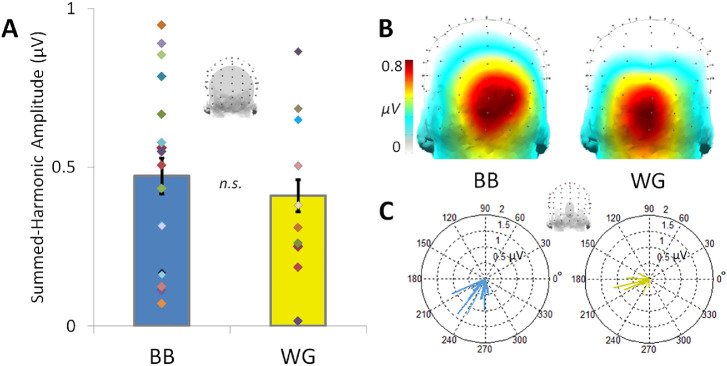
Figure 4.
The blue-yellow summed-harmonic 3-Hz responses across blue-black (BB) and white-gold (WG) observers. (A) The mean response amplitude does not significantly differ across blue-black and white-gold perceivers over the occipito-parietal region-of-interest; individual participant amplitudes, indicated by randomly colored diamonds, occur over a wide range in each group of observers. Error bars indicate ±1 standard error from the mean. (B) Response amplitudes are nevertheless distributed with apparent spatial differences within the occipitoparietal ROI across the perceptual groups (see also Figure 5). (C) The phase of the responses across blue-black and white-gold perceivers. Individual phase values, taken from the small medial-occipital ROI indicated above, are plotted according to cosine phase angle, with the length of each vector determined by the respective amplitude.

