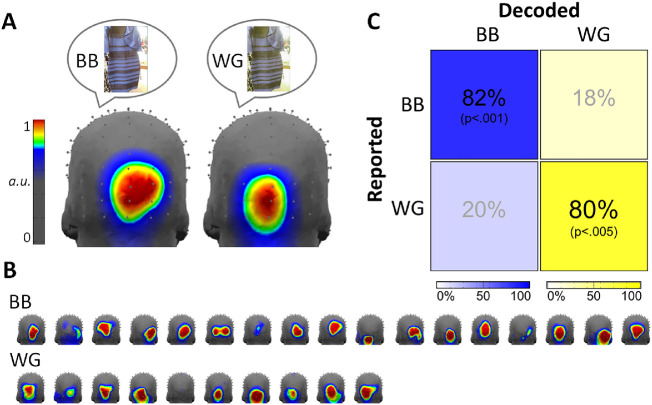
Figure 5.
(A) Topography of summed-harmonic blue-yellow asymmetry (3 Hz) responses for blue-black (BB) and white-gold (WG) observers. Illustrative dress images are intended to represent perceptual differences; the dress stimuli presented were identical for both groups. Response topographies are normalized across all 128 channels. (B) The corresponding data of each individual observer, sorted by reported perceptual group, plotted to the same scale as in section A. (C) Decoding accuracy of white-gold and blue-black observers based on correlating the spatial distribution of responses over the occipitoparietal region-of-interest with a leave-one-participant-out across-groups approach.

